Table of Contents
Report
QRioCity Current Logo

Author(s):
- Jakob Zschocke
- Chloé Herlange
- Anita Pyciak
- Lina Blaschke
- Bram Blauw
Acknowledgement
The team would like to thank the Instituto Superior de Engenharia do Porto (ISEP) university for providing us with their facilities during this semester. Furthermore, the team expresses its gratitude to the organizers and teachers of ISEP and the European Projects Semester (EPS) for sharing their knowledge with us during this semester. We are grateful for the opportunity to take part in this project, grow and gain new experiences.
Glossary
In Table 1 the glossary used in our report is presented.
| Abbreviation | Description |
|---|---|
| EPS | European Project Semester |
| ISEP | Instituto Superior de Engenharia do Porto |
| IoT | Internet of Things |
| QR | Quick Response |
| NFC | Near Field Communication |
| WA | Web Application |
| PWA | Progressive Web Application |
| HTTPS | HyperText Transfer Protocol Secure |
| OTA | Online Tour Operators |
| OAA | Online Activity Agencies |
| B2B | Business to business |
| B2C | Business to client |
| C2C | Customer to customer |
| VR | Virtual Reality |
| Wi-Fi | Wireless Fidelity |
| SWOT | Strengths, Weaknesses, Opportunities and Threats |
| App | Application |
| PDCA | Plan, Do, Check, Act |
| 4Ps | Product, Price, Place, Promotion |
| SMART | Specific, Measurable, Achievable, Realistic, Time-bound |
| LCA | Life Cycle Analysis |
| UC | Use Case |
| PV | PhotoVoltaic |
1. Introduction
The European Project Semester (EPS) offers students the opportunity to complete a project at a partner university under academic supervision over the course of one semester. It is designed to prepare engineering students, and others, to face the challenges of today's world. Students work on a project in a multinational and interdisciplinary team. Project participants communicate in English and receive guidance from supervisors on how to focus on both the product and the project.
This report describes all the steps that reflect the work and research done by Team 3 during the European Project Semester at the Instituto Superior de Engenharia do Porto. This chapter will introduce our team members, a description of the problem, and our main goals.
1.1 Presentation
Our team consists of five international students from different backgrounds. The members, and information about their country of origin and field of study are shown in Table 2. Under the guidance of a team of professors from ISEP, we work on a multidisciplinary project whose topic is “Our city experience”. We are combining our knowledge and skills to create a product that will solve the problem of young tourists being overwhelmed by the number of possibilities of exploring a city while being limited in time and money, and will also help the city municipality to attract new tourists as the current system is a bit outdated.
| Name | Field of Study | Country |
|---|---|---|
| Jakob Zschocke | Industrial Engineering | Germany |
| Chloé Herlange | Engineering | France |
| Anita Pyciak | Business and Technology | Poland |
| Lina Blaschke | Media Technology | Austria |
| Bram Blauw | Industrial Product Design | Netherlands |
1.2 Motivation
Our motivations to participate in the European Project Semester was primarily to expand our knowledge and go out of our comfort zone. Studying abroad gives us the opportunity to explore other perspectives and develop out-of-the-box thinking. Moreover, by working on the project we improve our English skills as well as learn about other cultures and the differences between them. Finally, we want to improve our ability to cooperate in a multidisciplinary group to achieve a common goal.
1.3 Problem
During this semester, we decided to address a problem that affects us as well. The topic that we have chosen was “Our city experience.” We decided to focus especially on tourism. According to our observations, as well as the information we acquired during our research, young tourists need a way to get the best experience out of their stay, but they are overwhelmed by the vast number of possibilities while being limited in time, money and local insights. They find the current options boring and not entertaining, it’s hard for them to explore a new city. Moreover, our product also solves the city government's problem, because they need a way to easily attract new tourists as existing tourism solutions are often outdated. As we all know, the more tourists a city has, the better the reputation of the city, the better the profits for the city and the more opportunities for development.
1.4 Objectives
Our goal is to provide an unforgettable experience for young tourists by creating an urban game that will allow them to explore specific aspects of a city. The city that we decided to focus on is Porto, but the solution that will be created by us can be used also in other places. To attract users, we plan to create a public display in a public place, and the game will be created as a web application that the user can open on his smartphone. This objective includes designing, programming, and testing a prototype. Marketing perspectives, environmental and ethical issues must be considered and applied throughout the project to meet the requirements.
1.5 Requirements
During the project, we must follow the requirements and limitations outlined below.
1.5.1 Initial requirements
- Use low-cost hardware solutions;
- Comply with the following EU Directives:
- Machine Directive [European Comission, 2017],
- Electromagnetic Compatibility [European Comission, 2017],
- Low Voltage Directive [European Comission, 2016],
- Radio Equipment Directive [European Comission, 2011],
- Restriction of Hazardous Substances in Electrical and Electronic Equipment Directive [European Comission, 2011],
- Mandatory adoption and use of the International System of Units [dominiodelasciencias, 2021];
- Use open-source software and technologies.
1.5.2 Limitations of the project
- A maximum budget of 100 €.
1.5.3 Usability requirements
- Easy to use for the users;
- The user must have a mobile phone (smartphone).
1.6 Functional Tests
In order to verify the performance of our product we need to perform functional tests. These tests will be divided into three categories.
The structure:
- We will perform structural strength tests using 3D simulation software. We will simulate a windstorm to test its resistance to wind and to make sure that the kiosk will not turn into a giant projectile.
- We will also do a shock resistance test. As the kiosk is located in a public and busy place, we have to check its resistance to shock in case of an incident.
The control:
- We are going to test the different functionalities that we want to add to our object with the help of a prototype.
The web application:
- We will test on a smart phone if our web application works as we expect it to, i.e. with all the expected functionalities.
- The performance and speed will be tested of the web application.
1.7 Project Planning
In order to organise the progress of our project we decided to use the SCRUM method. For this we need to define a scope. This scope allows us to identify the tasks which need to be carried out for the entire project. The backlog documents these tasks. A global sprint plan devides the available time in week long sprints. Every week begins a new sprint where new tasks are being adressed. At the beginning of a sprint the first few tasks in the backlog, which are prioritised, get added to the current sprint. When the sprint finishes the worked on tasks will be reviewed and new ones get added to the new sprint plan.
This method allows us to keep a clear overview of the progress, keep an organized working structure and dvivide tasks efficiently.
1.8 Report Structure
The report is organized in 8 chapters as can be seen below in Table 3.
| Chapter | Description | |
|---|---|---|
| 1 | Introduction | Presentation of the team, topic of the project, the motivation, the problem to be solved and requirements. |
| 2 | State of Art | Research and analysis of the solutions connected to our problem that already exist in the market. |
| 3 | Project Management | Definition and analysis of aspects important for the project; scope, people, communications and risks. |
| 4 | Marketing Plan | Research and analysis of the market, definition of the marketing strategy that will be used and applied in our solution. |
| 5 | Eco-efficiency Measures for Sustainability | Description of sustainability of the project from social, economic and environmental level. Making our product as sustainable as possible. |
| 6 | Ethical and Deontological Concerns | Analysis of ethical challenges and limitation of the challenges associated with our product. |
| 7 | Project Development | Design and prototype of the product and carrying out the final tests and their results. |
| 8 | Conclusions | Summary of the work that has been done, stating possible improvements of the product in the future, conclusions. |
2. State of the Art
2.1 Introduction
In this chapter different topics that in some way relate to this project were researched, important aspects were summarized. First, the aspects in tourism to which the project could be applied were investigated. The need for organized group activities became apparent and how tourists increasingly look for personalized and engaging experiences. Secondly, it was explored how today's technology can enhance the tourism experience. Two trends became visible, the use of machine learning and the use of smart devices and Internet of Things (IoT) systems. Machine learning was mainly used to improve recommender systems and smart devices make touristic destinations smarter and more connected. Furthermore, the concept of gamification and its impact in tourism were explored. Gamification is an underestimated tool in most business sectors even though it can benefit both users and brands/companies. The use of gamification, among other things, creates an engaging and fun experience for the user and it promotes brand loyalty and can bring useful user data to the company. After researching different theoretical topics, developing options were investigated to find the perfect fit for this project. Market researched helped to see what current applications are available and what elements could be implemented or improved. Lastly, specific options for implementing the project were compared, Near Field Communication (NFC) versus Quick Response (QR) codes and progressive web applications (PWA) versus native applications. After all this research a conclusion was drawn to create a clear concept of the project.
2.2 Group activities
Current tourism not only focuses on destinations or places, but also on creating experiences. This market experienced a major push from information and communication technologies. Tourism must be understood as a customer-focused experience both online and offline and not just as a service. The customer seems to derive added value from outstanding, unforgettable and personal services or products. Experiences are no longer passively consumed, but actively, dynamically and participatory co-created. Therefore, experiences aren't just designed and delivered suitable for the masses, instead they are collectively created by providers and consumers (tourists)(=Experience co-creation). It is therefore easy to understand why digital technologies play an essential role in connecting different parties (B2B - Business to business, B2C - Business to client, C2C - Customer to customer). “The pre-trip phase can be described as an active and socially intensive phase. Tourists use a variety of technologies and media to help them inspire, plan, transact, book, and interact with service providers (B2C) and other consumers (C2C). For example, consumers search for travel information, photos, and reviews on TripAdvisor or booking sites to facilitate decision making. Another example of the pre-trip phase is innovative inspiration and idea generation platforms, such as PixMeAway, which use intuitively selectable images to inspire consumers and recommend suitable countries, cities and regions for future trips. Especially in the pre-travel phase, virtual reality (VR) has gained great importance, in addition to the already established online websites” [Barbara Neuhofer, Mattia Rainoldi, 2016]. During-Journey: Mostly the highlight of the customers journey. Key technologies: location based services and products, VAR. There are quite a lot of digital approaches.
Tourism organisations create and amplify the experiences, impressions, and magical moments that guests should experience from and in specific travel regions. Product development in tourism is strongly linked to the creation of unforgettable experiences. Understanding travel as a social and psychological phenomenon (longing for rest, relaxation, adventure, a counter-world of everyday life, enriching experiences, valuable encounters and memories) is the basis for aligning tourism product experiences with guests' travel motivations. Even the modern travellers sharing their experience - called bloggers, Instagrammers or influencers - are in real and digital life going after the experiences of the region and not after the hotels, arrangements or the number of slopes.
The vast majority of tourism value is created locally in the context of gastronomy, local transportation, and experiential services. The fact that the majority of the market and value creation potentials in experience services (gastronomy, transport, culture, sports, experience, encounter, …) are created locally has been treated rather stepmotherly by tourism professionals for years. Digital distribution of experiential services was also dismissed for a long time by tourism organizations as “not scalable,” “too small-scale,” or “not digitally relevant.” Internationally, however, this trend has long been established and online reservation platforms, so-called activity booking engines for experiences, leisure activities, tours and guides have been around since 2007. These platforms, on which experience and leisure providers can offer their own offers ranging from mountain tours to beauty treatments and archery courses to paragliding tandem flights, are the “suppliers” and, as so-called consolidators, technical-organizational partners for the true sales giants of touristic experiences, tours and activities - the experience sales platforms and experience brokers. Similar to Online Travel Agencies (OTA), these bundles the inventory from activity booking engines into online sales platforms - we therefore call them OAA - Online Activity Agencies:
- Jochen Schweitzer;
- Viator;
- MyDays;
- Jollydays;
- Get your Guide.
This is also exactly what is at stake today more than ever when trying to efficiently implement tourism brand management: Place-making with authentic, honest stage paraphernalia such as attractions, museums, city centres, rivers, lakes, mountains and natural landscapes. Place branding follows as a logical consequence and uses contemporary communication channels from Youtube to Snapchat, from Twitter to Google Earth, to carry the authentic stage paraphernalia of the world's most attractive destinations around the world as snackable content [Daniela Wagner, Martin Schobert, Georg Christian Steckenbauer, 2019].
2.3 Modernising Tourism
When considering to modernise and digitize the tourism sector a few trends are visible. At first there were mobile applications that came with the rise of the smart phone. Now there is a plethora of applications that make traveling easier. From booking a flight to finding a hotel and getting reviews on every place you could visit. By now this is not new anymore. What is new is for example the use of deep learning in recommender systems. For example, [Septia Rani, Dimastyo Muhaimin Arifin, Sheila Nurul Huda, Dhomas Hatta Fudholi, 2021] produced an application with case-based reasoning, so the user was asked to enter personal information and choose some preferences and then got recommended the matching attractions. Due to the sheer overload of information available, recommender systems are becoming increasingly important. So new and improved methods are emerging with more focus on personal recommendations. Although new methods are being developed, they cannot be adapted easily due to the workload connected to data collection and labelling. Aside from recommender systems for separate attractions, [Chenzhong Bin, T. Gu, Yanpeng Sun, Liang Chang, Lei Sun, 2019] proposed a tangible travel tour (inside one point of interest) recommender method using smartphones and an IoT environment. First, they tracked tourists travel data with Bluetooth low energy beacons and could then recommend a calculated travel route to a new user. This project was not yet implemented in a real life situation because of problems related to data collection.
Another way to modernise the tourism sector is to use smart devices and IoT applications. According to the survey analysis of [Ahmadh Kariapper, Pirapuraj Ponnampalam, Suhail Razeeth, A C M. Nafrees, Ahamed Sabani Mohamed Jamaldeen, 2020] the tourism industry can obtain considerable advantages through using smart devices, mainly wearables and IoT applications. Wearables are especially useful seeing as tourists move quickly from one place to another. They beat smartphones in the regard of battery performance and charging time. Every device has some drawbacks but when combined and suited for the situations they can be mitigated. [Xudong Guo, Yuxuan Wang, Jieqiong Mao, Yiming Deng, Felix T. S. Chan, Junhu Ruan, 2021] propose that with the help of 5G and IoT technologies, smart tourism can be promoted to the maximum. They define this as IoT enabled tourism. “IoT enabled tourism is an IoT enabled system which applies various information and communication technologies to interconnect all the five elements of tourism: tourists, generating regions, transit routes, destination regions, and the tourist industry and makes all these tourism elements smart by the interconnection of IoT devices in the tourism”.[Xudong Guo, Yuxuan Wang, Jieqiong Mao, Yiming Deng, Felix T. S. Chan, Junhu Ruan, 2021]
2.4 Gamification and Interaction
Another big trend in tourism is gamification, artification and interactive installations. Making an experience extra enjoyable through games or art, engaging the user through added incentives. Gamification in tourism does not only attract tourists and engages them to co-create experiences but also helps to build destination loyalty [Maria Giovina Pasca, M. F. Renzi, R. G. Mugion, Martina Toni, L. D. Pietro, 2020]. In various phases of travelling, gamification is known to bring benefits not only for the consumer but the company as well used as an innovative marketing tool. Tourists might strive for interaction, connecting with others and socializing and games or game-like experiences offer that. Benefits for the user include creating an entertaining and personalized experience, it also improves retaining information about the destination. For the company it can provide useful user-information, increase brand awareness and bind the customer to the company. A game to combine all these benefits must be based on the customers motivations and objectives as well as their profile. Gamification is called the cutting-edge trend in tourism [Feifei Xu, Dimitrios Buhalis, 2021]. Examples of gamification can be literal games like quizzes or scavenger hunts, either online or with tangible objects. Other versions might indulge the user in a roleplaying story that they emotionally connect to. Mobile applications being the easiest to implement or market to users. Another way to gamify is to only use game mechanics like giving points or rewards or introduce levels or rankings. This can give users extra incentive to engage with the proposed service. Especially rewards can motivate people to, for example, leave reviews or sign up for services. Gamification can be implemented in many ways, most accessible are applications, desktop, mobile or web, augmented reality is mostly used in museums to educate, virtual reality is used a little less but geocaching is a convenient way to implement some kind of treasure hunt [F. B. P. Prakasa, S. Suyoto, A. W. R. Emanuel, 2021]. In conclusion gamification can be an innovative, entertaining and personalized engagement for tourists and additionally can be beneficial for all parties involved.
If the tourist is interested in art or taking part in an installation, technology can also improve these experiences. Museums that provide options for visitors to interact with physical objects are more attractive to a wider range of people than solely visual forms of teaching information. Simply providing physical buttons or technology-enhanced physical objects to navigate information already improves the visitors' experience. George Margetis, Dimitris Grammenos, George Paparoulis and Constantine Stephanidis created a digital catalogue for various use cases like public display or heritage information which can be navigated through touch or context designed physical objects (windmills, a ship's wheel, etc.)[George Margetis, Dimitris Grammenos, George Paparoulis, Constantine Stephanidis, 2017]. Another kind of interactive installation was made by Kate Galloway where she used geolocation to create a soundwalk through a specific area in Canada, playing poems, sounds and interviews through the listeners device [Kate Galloway, 2018]. Interactive installations can be a creative outlet for builders and visitors, it can create lasting memories but also have teaching effects. It can be used as a marketing strategy but rather classifies as creative or educational.
Another great way to interact with tourists are public kiosks. [Partteam & Oemkiosks, 2020] summarize the functionalities and benefits of using a display/kiosk to help or attract tourists in their article. It's a great tool to distribute information, to purchase tickets, design interactive experiences, Wi-Fi hotspots, unmanned check ins/outs, etc. In Porto it is also often used for queue management. These displays don't only have many use cases but also many benefits, including, mitigating language barriers, improving the tourists experience, increased revenue for local businesses, catches users attention and sparks curiosity and so on.
2.5 Comparison between development solutions
During the initial phase of the project, we had to make two important decisions that affected further work. We had to decide whether we want to use QR codes or NFC, and if we want to create a web app or a mobile app. In order to make a decision we analyzed the advantages and disadvantages of both approaches. The fidings are presented in the Tables 4, 5, 6 & 7 below.
| Pros | Cons |
|---|---|
| Easy to program | Not really secured |
| Standardized, any device can scan it | Easy to falsify |
| Cheap to produce | |
| Easy to use |
| Pros | Cons |
|---|---|
| Easy to program - there are special apps | Less secure than QR Codes |
| It can connect to any link | High price - around 1 € per tag |
| Not all phones have NFC in their functions | |
| If it is not secured, it's easy to steal |
| Pros | Cons |
|---|---|
| Works on every device if designed responsive | Needs constant internet connection |
| Doesn’t use too much storage | Slower/less advanced in features |
| Easier to get up and running/maintain | |
| Quick and easy to build | |
| Security not automatically guaranteed for the user | |
| PWAs have to run on https | Geofencing only on app |
| No installation | Interaction with other apps only on app |
| Not as much space as app | Other smart functions only on app |
| PWA Performance better than WA not than native app |
| Pros | Cons |
|---|---|
| Works completely offline - how much Data does a webapps safe? | Needs to be adapted for different phones |
| Context aware | Users are more opposed if you have to do something |
| Quicker access to camera | “more expensive” |
| Faster, more efficient, safer | “long wait to get approved” |
| Easier to build due to developer tools | “how is it connected Place-making with authentic, honest stage paraphernalia such as attractions, museums, city centres, rivers, lakes, mountains and natural landscapes is the order of the day. with the display?” |
2.6 Conclusion
Based on this study of the state of the art, we decided to adopt the following components: a progressive web application which should create an engaging, competitive game for groups of all sizes around the city of Porto, plus a public kiosk/display to attract users. This set up was chosen because gamification is one of the best ways to give users a personalized and engaging experience whilst educating about a tourist destination and can at the same time promote local businesses. The crucial points for choosing a web application were time and accessibility. Seeing as progressive web apps come really close to adapting all positive features of a native app as well as our time for developing being limited and the need to cater to as many people as possible, a PWA seemed like the better fit. This way every tourist with a phone can easily participate without having to be convinced to download an app, the only concern being that tourists do not always have an internet connection but Porto provides a free Wi-Fi connection so this problem can be mitigated.
Additionally different already existing solutions that could be considered competitors were analyzed and compared in Table 8 Different key factors were looked at, to see where our product can stand out.
| Name\Feature | For free | Personalized | Interactive / actively creating an experience | Educative | Local insights | Community driven | Guided online or in person | Directly approaches the user | Competitive | Inclusive (tourism/citizen) | Possibility to interact with service providers (B2C) or other customers (C2C) in advance ? How ? | Modern tourism (deep learning / smart devices | Achievements / rewards | Local value creation | Game |
|---|---|---|---|---|---|---|---|---|---|---|---|---|---|---|---|
| Questo | no | half | yes | no | yes | yes | online | no | yes | yes | web/app | no | no | yes | yes |
| Enigmas tours | no | half | yes | no | yes | no | online | no | no | no | web app/web | no | no | yes | yes |
| City game | no | half | yes | no | yes | yes | online | no | yes | no | web | no | no | yes | yes |
| Goosechase | no | half | yes | no | no | yes | no guided tours | no | yes | no | no | no | no | yes | yes |
| Actionbound | yes | half | yes | no | yes | yes | online | no | no | no | app/web | no | no | yes | yes |
| Geocaching | yes | no | yes | no | no | yes | no | no | no | no | no | no | no | yes | yes |
| Streetography | no | no | no | no | yes | yes | no | no | no | yes | yes | no | no | yes | no |
| Pokémon Go | yes | yes | yes | no | no | no | no | no | yes | no | no | no | yes | yes | yes |
| Tripadvisor | yes | yes | no | no | yes | yes | no | no | no | yes | app/web | yes | no | yes | no |
| Google maps | yes | yes | no | no | half | yes | online | no | no | no | app/web | yes | no | no | no |
| Guided tours | no | yes | yes | yes | yes | maybe | offline | yes | no | half | web/over phone | no | no | yes | no |
| Tourist information offline/online | yes | yes | no | no | maybe | no | no | yes | no | half | app/web/books | no | no | yes | no |
| Online traveling agencies | no | yes | yes | no | yes | yes | offline | yes | no | maybe | website | no | no | yes | no |
| QRiocity | yes | yes | yes | yes | yes | possible | yes | no | yes | yes | web app/web | possible | yes | yes | yes |
In the following chapter, we will present an overview of project management throughout the semester.
3. Project Management
Project management is the use of processes, methods, skills, knowledge, and experience to achieve defined project goals in accordance with project acceptance criteria within established parameters. Project management aims to achieve final outcomes that are limited to a specific time and budget [Association for Project Management, 2019]. In this chapter, we will provide an overview of our project management methods and an analysis of the various aspects involved in managing people, resources, cost, risk, and time.
3.1 Scope
Project scope is the part of project planning that involves defining everything that must be accomplished to complete the project. Specifically, it involves identifying and documenting a list of specific project goals, deliverables, features, functions, tasks, deadlines, and costs [Heather, 2019]. After defining the project's main objective, we created a simple hierarchical structure consisting of the major tasks and deliverables that are needed to successfully complete the project. The Work Breakdown Structure (WBS) technique allows work to be divided into smaller tasks to increase productivity and make work easier [workbreakdownstructure.com, 2022]. Using this technique, we divided the project scope into six parts: Initial, Design, Interim, Executive, Test, and Final. Each part has specific tasks that need to be completed. We also used this tool to analyze our product.
Figure 1. shows Work Breakdown Structure (WBS) of our project:

Figure 2. shows Work Breakdown Structure (WBS) of our product:

3.2 Time
Figure 3. shows the gantt chart of our project.The Gantt chart allows us to organise the project in time according to the different tasks to be accomplished.

3.3 Cost
In order to carry out our project we have a budget set by ISEP of 100 €. As our project will be street furniture we cannot consider the budget allocated to our project for the actual product. We will therefore first study the cost of our prototype, then we will plan the cost of our real product and finally we will see the planning of the costs of promoting our project.
3.3.1 Prototype cost
Table 9 shows our prototype cost, the delivery prices are in Table 14.
| Component | Provider | Price [€] |
|---|---|---|
| Ultra Sonic Sensor HC-SR04 | Team member | 3.65 |
| (Elegoo) Uno R3 | Team member | 38 |
| Laptop with touchscreen | Team member | 559.97 |
| Jumper Wires | Team member | 2.30 |
| Mini-Speaker | Team member | 8.00 |
| SHIELD MP3 VS1053 | external provider | 11.60 |
| 16 GB Micro SD card | Team member | 8.72 |
| Total include delivery price | 635.94 | |
| Total that we payed | 15.30 |
3.3.2 Final product
Table 10 shows our estimation for final product cost.
| Component | Provider | Price [€] |
|---|---|---|
| Ultra Sonic Sensor HC-SR04 | Team member | 3.65 |
| (Elegoo) Uno R3 | Team member | 38 |
| touch screen | external provider | ≈ 1800 |
| Jumper Wires | Team member | 2.30 |
| Mini-Speaker | Team member | 8.00 |
| SHIELD MP3 VS1053 | external provider | 11.60 |
| 16 GB Micro SD card | Team member | 8.72 |
| solar panel | external provider | ≈ 2700 |
| Aluminium | external provider | 1342.5 |
| Mycellium | external provider | ≈ 100 |
| Total | 7014.77 |
3.3.3 Marketing
The promotion of the product is a very important step in the project. It allows us to give visibility to the product and therefore to have new potential customers, new users and new professional partners in the tourism industry. In order to promote our product we have drawn up a financing plan which can be found at the end of chapter 4.7 Budget, Table 22
3.4 Quality
Quality is the conformity of the project with the requirements defined for it at the outset. It must be an objective that is clearly defined and shared by all the actors in the project, which is the quality management plan. It must correspond to the customer's expectations and therefore be customer-oriented. However, as it is a goal for all the members of the team, it must also ensure that the manufacturing process is working properly - this is quality assurance. Finally, we have to establish checkpoints in order to control the quality of our project and our product.
Quality is composed of five main phases:
- Validation: establishing customer expectations
- Verification: compliance with customer expectations
- Precision: Checking the repeatability and capability of the control points
- Accuracy: no errors, correctness of measurements
- Tolerance: Acceptable amount of error when the measurement is not perfect
In order to follow our quality approach we have implemented the smart method in our project, which you can find in chapter 4.4 Strategic Objectives . In addition, we have made a risk assessment (chapter 3.7) which allows us to be aware of what can go wrong during our project and in the future.
Our quality control will be based on:
- Attractiveness: 10% of people interacting with the screen start the game first month and 10% of them start and finish the game.
- Partnership: 40% of users use vouchers
- Environment:
- Packaging 100% reusable / biodegradable.
- 2 years without changing the screen and 6 years without changing the case.
- Measure energy consumption needed linked to weather to know the perfect brightness of the screen to avoid waste of energy
3.5 People
The people associated with a project (stakeholders) are one of the key factors in project success. It is important to identify them in advance in order to properly manage them during project implementation. In Table 11, we have outlined all project-related stakeholders and their roles, as well as their influence and power during the project.
| Key | Stakeholder | Role | Power | Influence |
|---|---|---|---|---|
| A | Team Members | Owners | High | High |
| B | Benedita Malheiro | EPS Coordinator | High | High |
| C | Supervisors | Supervising the project development | High | Medium |
| D | Teachers | Providing resources and support | Medium | Medium |
| E | ISEP | Main Sponsor | High | Medium |
| F | Customers | Client | Medium | High |
| G | Tourists | Final Users | Medium | High |
| H | Citizens | Final Users | Medium | High |
| I | Suppliers | Providing Materials | Low | Medium |
| J | Investors | Financial or Material Sponsors | Low | Medium |
| K | Competitors | External Influence | Low | Low |
| L | Local businesses (restaurants, museums, cafes, cinemas, bars, gift shops, traditional shops, fado’s events) | Sponsoring cooperation | Low | Medium |
3.6 Communications
Communication is crucial in a project where many people work together. If the team is not communicating properly and effectively, the project will be hard to complete successfully. Communication is important not only within the project team, but also between other stakeholders. It is important to communicate on an ongoing basis and to report on changes from time to time so that changes can be made when they are needed. It is important to ensure that all members have the opportunity to express their beliefs and that issues that arise during the project are addressed appropriately. Communication is one of the pillars of a good project.
During the project our communication channels are:
- Between team members: Online and offline meetings, WhatsApp, Teams, and the wiki to share all the information.
- Between supervisors and team: Teams and wiki to share some information about the progress of the project, weekly meetings.
- Between team and external stakeholders: flyers, poster, advertisement, leaflet.
In Table 12, we have shown the communication management during the project.
| Key | Stakeholder information requirements | Timeframe/Frequency/Trigger | Prefered communication medium |
|---|---|---|---|
| A | Provide update on project progress, Provide input to requirement, Direct communication with supervisor | weekly and ad hoc as needed, ad hoc as needed, weekly | Oral |
| B | Provide advice and deadlines, Receive report, schedule and feedback about project | weekly and ad hoc as needed | Oral & written |
| C | Provide advice | weekly and ad hoc as needed | Oral & written |
| D | Provide ressources and support | During classes and ad hoc as needed | Oral & written |
| E | Provide facilities | Daily | Written |
| F | Receive information about product | At the end of the project | Written |
| G | Receive advertisement about the game | During using of the product | Advertisement & written |
| H | Receive advertisement about the game | During using of the product | Advertisement & terminal |
| I | Suppliers | Providing Materials | Written |
| J | Receive information about project, provide funding | Written | |
| K | Receive advertisement about the game | During using of the product | Advertisement |
| L | Receive advertisement about the game, Provide fee | before and during using of the product | Advertisement & written |
3.7 Risk
Risk is an uncertain event that may or may not occur during a project and affects it to specific extend with specific probability and impact [ProjectManagementInstitute, 2008]. Once the key risk factors are identified, there is also a need to consider whether or not they are relevant and how they can be addressed. Risk management is the process of identifying, assessing and controlling risks to a project. Risks can come from many different sources, including technological problems, strategic management failures, accidents, or natural disasters [J. B. Maverick, 2020]. Ranking hazards is the way to help determine which risk is the most serious and thus which to control first. In our project, we decided to assess risks based on impact and probability using a scale from 1 (lowest) to 5 (highest).
Table 13 presents the risk analysis of our project:
| No | Risk | Category of the risk | Cause | Effect | Probability | Impact | Resolution |
|---|---|---|---|---|---|---|---|
| 1 | Not enough information presented during a trip | Technical | Lack of testing / Small amount of testing | Frustration of participants, necessity to stop the game | 2 | 4 | Adding more information, test game properly |
| 2 | Destroyed authenticity of local places | External | Too many tourists in local places, worse experience because of crowded space | Destroyed authenticity, uniqueness of the place | 2 | 4 | Find balance between amount of people visiting one place in one time |
| 3 | Conflicts inside the team members | Internal | Misunderstanding, communication problems | No cooperation and delay of work | 1 | 4 | Dividing and fulfilling the tasks on time, find ways to compromise |
| 4 | Lack of appropriate skills and knowledge | Internal | Lack of specialists in the given field | Delay of work, tasks done incorrect | 3 | 3 | Doing the research, use the help and directions from supervisors |
| 5 | User is getting bored during game | External | Lack of proper testing, to less amount of testing, boring tasks | Puzzle too easy to solve, game become useless, not interesting for people | 2 | 4 | Test the tasks before for different types of personalities |
| 6 | Programming errors/Bugs in software | Technical | Human error, lack of testing | Non-working device | 1 | 2 | Repairing the error |
Figure 4. shows Risk Assesment:

As you can see from the chart, we do not have any risks that are both very likely and have a very significant impact on our project. Among the most dangerous risks, we can point out problems with insufficient information for the player, as well as possible boredom with the game. In order to avoid these risks, we have to think over and test the game well, to put enough information in it, so that the user would be able to solve the puzzle, but not too much so that he would not be bored with the game. As for other risks, we will have to deal with a lack of proper knowledge/training in specific fields of study, which can lead to errors and delays in work.
3.8 Procurement
Procurement is an important step in the project. In order to meet our budget of €100 and our deadlines we need to establish a procurement strategy. We have tried, as much as possible, to buy products available in Portugal. Buying these products has several benefits for us:
- Economics: the delivery is cheaper
- Speed of delivery
- Environmental: the closer the components are to us, the less polluting their transport is
Below you will find a table presenting the material used, its cost, its origin and finally its delivery time and cost.
Table 14 shows the procurement's information for the component we acquired.
| Picture | Component | Price[€] | Origin | lead time (day worked) | Delivery time | Delivery price {€] | preferred vendor | alternative supplier |
|---|---|---|---|---|---|---|---|---|
 | SHIELD MP3 VS1053 | 11.60 | Portugal | 2 | 2 weeks | 3.70 | botnroll.com | PTROBOTICS |
3.9 Stakeholders Management
In the stakeholder management it’s important to identify all the different stakeholders and to find the best strategies in order to incorporate them in the process and keep them happy. This chapter will discuss the identification of the stakeholders, followed by the strategy in order to keep them satisfied.
3.9.1 Identification
We will identify the different stakeholders and their role in our project.
Team members - They are the ones who lead the project, make the most important decisions and coordinate all the stakeholders in the project. They are multi-taskers and carry out all product and project development.
EPS coordinator and supervisors - They offer advice and possible improvements to the project to members of the project team. They check that what the team is doing is going in the right direction. They answer questions about the progress of the project and new solutions proposed by the team.
Teachers - They explain how the different chapters of the report should be carried out. They give the tools to understand and apply the different concepts that the team needs to achieve the project.
ISEP - Provides the infrastructure and some of the materials needed for the project to succeed
Suppliers - They provide us with the components we need to make our product work. In addition, they provide us with the technical instructions for these products.
Investors - They provide us with the necessary funds to develop our project.
Competitors - They don't really have a role in our project but we have to pay attention to them. We always have to be aware of what they are doing in order to develop our product in the best possible way.
Local businesses - We need to develop good partnerships with these local businesses in order to get discount vouchers to offer at the end of the game. These vouchers will allow our team to promote the game and our partners to get more customers.
City board - In order to get the right licenses to be able to place and operate a public display and different QR codes throughout the city, we need to be in close contact with the board of city hall. Usually boards of city halls are very hard to get into (quick) contact with, but it’s our most important stakeholder. Big chances that we will get in contact with an employee of city hall responsible for public products instead. Whoever we're in contact with, it’s extremely important to keep them happy, otherwise the project won’t be able to be realized.
Tourism of Porto (Turismo de Portugal) - It’s important to work well together with the tourism office of Portugal since they can provide us with a lot of valuable information. Since it’s a product with tourists as its target audience, the tourism office will be important since it's very interesting for us to work together with them. There’s a big chance they have a multiyear plan for the future of tourism in Portugal and this product needs to adhere to that plan.
City cleaning - Keeping the city clean is usually the job from a department of city hall. It’s important we take them into account since there might be certain instructions needed in order to properly clean the screen. Since this is very hard to implement, it's more interesting to clean the screens ourselves since we're also maintaining and repairing the screens. This stakeholder is less important since we will be offering service together with the screen, this includes maintenance and cleaning could be part of maintenance.
Tourists - This group will be our users, it’s mainly important in the process of designing to really look at what they want and what they value. The group is hard to get involved since it’s a group of people with no real representatives (except for Turismo de Portugal), so that’s why it’s important to always keep them in the back of our minds.
Mechanics - The mechanics will be employees of QRioCity and will get a course in how to install our display screen and QR codes. Furthermore, they will get a course on how to maintain the display. This will include cleaning, repairing, updating and everything else related to maintaining the display. It’s important to keep them in mind during the design process, just like with the tourists.
3.9.2 Strategy
In this chapter the strategy concerning the satisfaction of the stakeholder will be discussed. It will be discussed how they will be involved in the project and how (often) they will be updated.
Team members - The team should communicate internally as much as possible, by different means (oral, written…) all team members should be constantly informed about the progress of the project and the tasks to be done. They should also work closely with all other stakeholders in the project.
EPS coordinator and supervisors - There is a weekly meeting between the team members and the supervisors. This meeting is to review the progress of the project, what has been developed and what remains to be done. In addition to this weekly meeting, the team and the supervisors remain in constant contact, in writing, in the event of a problem or if important information arises.
Teachers - The team can exchange with the teachers during the lessons scheduled in the timetable but also outside, notably by e-mail or via teams, in order to get feedback on the work done.
Suppliers - The team contacts them in order to purchase the necessary components for the project and if it encounters any problems with the use of these components.
Local businesses - The project team has to meet with local businesses during general information meetings or personal appointments in order to convince them of the concept and thus obtain more partnerships.
City board - There will be weekly meetings with the city hall representatives and their opinion is the most important for this project. The meetings will be in person and a weekly summary of the meeting will be sent to them by email.
Turismo de Porto - Turismo de Porto will be invited to the city board meeting and will be sent the same summary. There will be a two weekly separate meeting planned with them in order to discuss further details with them which won’t be concerning the city board.
City cleaning - There will be one meeting with city cleaning during the design process in order to identify their needs for the product. Furthermore, there will be a second and final meeting with city cleaning in order to get feedback on the product and make final adjustments.
Tourists - In the meetings with Turismo de Porto the tourists will be somewhat represented but it’s not quite the full representation we’re looking for in order to fully satisfy this group. Two different focus groups will be held during the design process in order to find out all the needs that tourists have when it comes to the display and the game.
Mechanics - There will be a supervisor appointed who will be responsible to take the mechanics needs into an account. That supervisor will be present for all the design meetings and will have a say in the decisions in order to keep the mechanics happy.
3.10 Sprint Outcomes
To organize our project we decided to use one week sprint. We have chosen that our sprints will start on the Friday and finish on the Thursday because it's the meeting day so we can plan our week in function of the information and discussion that we had during the meeting.
Table 15 shows the tasks that we did during our project.
| Task | Estimated duration ( days) | Real duration (days) | responsible |
|---|---|---|---|
| Sprint 01 21.04.2022 - 28.04.2022 | |||
| Improve wiki | 3 | 3 | Anita, others |
| 3D model | 2 | 3 | Bram, Chloé |
| Finish list of components for prototype | 2 | 2 | Lina |
| Sprint 02 29.04.2022 - 05.05.2022 | |||
| List of materials real project | 6 | 6 | Lina, Bram, Chloé |
| Improve wiki | 4 | 3 | all |
| Improve management chapter | 4 | 6 | Anita |
| Power budget for component + solar panels | 4 | 3 | Jakob |
| Create user story | 3 | 3 | Lina |
| Sprint 03 06.05.2022 - 12.05.2022 | |||
| Improve and fix report | 6 | 6 | all |
| Model 3D video with text | 2 | 2 | Bram |
| Discuss how app works | 3 | 4 | all |
| Simulation tests | 2 | 2 | Bram, Chloé |
| Sprint 04 13.05.2022 - 19.05.2022 | |||
| Homework | 5 | 5 | all |
| Research on toolbox | 5 | 5 | Jakob, Lina |
| Diagram of app | 3 | 3 | Anita, Jacob, Lina |
| Sprint 05 20.05.2022 - 26.05.2022 | |||
| find toolbox | 4 | 4 | Jakob,Lina |
| Mock-ups web app | 2 | 3 | Anita |
| Scientific poster | 3 | 2 | Lina |
| Packaging | 3 | 3 | Bram |
| Start paper | 2 | 4 | all |
| Improve 3D model video | 1 | 1 | Bram |
| Ethic chapter | 5 | 5 | Chloé |
| Sprint 06 27.05.2022 - 02.06.2022 | |||
| Start arduino code | 5 | 4 | Lina |
| 3D modelVideo | 1 | 1 | Bram |
| Improve project management chapter | 4 | 6 | Chloé |
| Sprint 07 03.06.2022 - 09.06.2022 | |||
| Finish project management | 4 | 5 | Chloé |
| Create concrete tasks for tour | 2 | 3 | Jakob, Bram |
| Create a tour | 2 | Jakob | |
| User manual app | 5 | 6 | Anita |
| Code app | 6 | Jakob | |
| Poster for user, eye-catching | 2 | 3 | Anita |
| Sprint 08 10.06.2022 - 16.06.2022 | |||
| Functional test web app | 2 | 2 | Jakob |
| Web app finished | 6 | 6 | Jakob |
| Report | 6 | 6 | all |
| Scientific poster | 2 | 2 | Lina |
| Poster for user | 3 | 3 | Anita |
| Video | 4 | 4 | Bram |
| Paper | 6 | 6 | all |
3.11 Sprint Evaluations
In the scrum/Agile project management method, it is advisable to organise the project in sprint of one to two weeks. We decided to do one-week sprints. These sprints are actually a list of things to do, each taken from the backlog according to their importance.The sprints allow the team to always know where they are and what they have to do.
At the end of each sprint there is a sprint closing ceremony called a sprint evaluation. During this ceremony the team meets and reviews the week that has just passed. They note what has been done and what is working, what they have started and stopped, but also and above all the positive and negative points encountered during the sprint.
This evaluation allows the team to move forward and find solutions together before starting a new sprint.
Table 16 shows our feelings during the project.
| Sprint | Positive | Negative | Start doing | stop doing | keep doing |
|---|---|---|---|---|---|
| 01 | Divided task with team member | Complete list of material not finished | Follow gantt chart | X | Be efficient |
| 02 | List of material finished | We don't know exactly how app will works yet | Real metting about important things | X | / |
| 03 | Good job about simulation and report | Need to modify 3D model video | Discuss how app works all together | Lose time about things not necessary | / |
| 04 | Good efficiency of the team | Need to modify 3D model video again | X | Be late on the task | / |
| 05 | Paper started | No feedback about ethic | Go faster with the report | X | / |
| 06 | Good job about marketing | No feedback about ethic | More communication within team | X | / |
| 07 | Good job about ethic and functional arduino test | We didn't finish the paper | Being stick to the plan | Trying to change the concept | / |
| 08 | Good progress, we were productive | feeling stressed to finish everything | update everything, keep in touch | X | / |
3.12 Conclusion
In order to carry out this project we decided to use the SCRUM method. We therefore studied the risks that could arise during the project. We identified the stakeholders in order to stay focused on the client while taking into account the external actors. We organised our project in sprints in order to control our progress and we tried to improve ourselves week after week using the sprint evaluations. These evaluations allowed us to see objectively the strengths and weaknesses of our team. Finally, to follow the development of our project in good conditions we defined our quality criteria, the procurement and the estimated costs. In the next chapter, we will focus on our main objectives related to the marketing plan, which is an important strategy to ensure the growth of our business.
4. Marketing Plan
4.1 Introduction
The role of marketing in an organization is to create strong and profitable relationships with customers. The marketer's role is to select the right people to reach, capture interesting market opportunities, communicate what products or services to offer and at what price, and decide on a distribution system. A marketing plan is an important element when developing a new product. It helps to know the actual market and to make the product visible to the public from a business point of view. In short, a marketing plan constructs a product so that it becomes profitable and valuable in the marketplace. However, marketing is not only about selling and advertising the product, the purpose of the marketing plan is to analyze and identify the needs of the customers and use them in such a way that the product can sell to the public. The product must communicate the value it holds in the best way possible so that the customer is fully satisfied and a long term relationship is formed. The purpose of this chapter is to develop a marketing plan for our product, considering the current market. In this chapter, we will introduce several things.
First, a market analysis to gather the information needed to develop a marketing strategy and specific marketing activities. Second, the SWOT analysis, which aims to identify the internal and external factors that are favorable or unfavorable for a profitable company/product. Third, we will determine what the strategic objectives of the product are using an intelligent methodology. After that, we will focus on the strategy and targeting issues. Then we will define and visualize the brand and the position of the product in the market. Next, we develop a Marketing Mix, consisting of the four P's (product, price, place, promotion) to find the right combination of factors to provide value to target customers. The final step is to control the budget and strategy to ensure the marketing objectives are met.
Our goal is to create a product that not only meets the requirements of the target audience but is also useful and innovative so that the created project can be sustained in the market for a long time.
4.2 Market Analysis
In the market analysis the available apps and displays on the market will be discussed and analysed. This will be done in order to get a clear view of what is and isn't available on the market. This way we can avoid copying other products and innovating a new one. An app and a display market research have been done. First the app market research will be discussed:
Questo
Questo (Figure 5) is an app that sells tours/games to tourists that want to find a new innovative way of exploring a city. The app makes a game out of exploring a city by giving you clues in order to find your destinations. After reaching the destination, you get asked a question which you can only answer with information found on the locations the app is leading you to.
ENIGMAS TOUR
Enigmas tour (Figure 6) is a Spanish company that offers city tours comparable with Questo. The biggest difference is that the tours from Questo is community driven, while the tours from Enigmas tour are from the company only. This means that the Enigmas tours are way more local and less tours available. Questo has tours all over the world, Enigmas tour has tours mainly in Spain.
City game
City game (Figure 7) can be played in Lisbon and for about 15 euros you can get a city game extremely similar to the ones mentioned before. It’s a fun way to explore a city through different clues. Users can pick routes with themes and parts of the city they want to explore.
Goosechase
Goosechase (Figure 8) is a game which is less about exploring a city, but more about exploring the world with your friends. Users can make lobbies with their friends and everyone will get an assignment, for example ‘make a picture of a man with a tophat’ and for each completed assignment they get points.
Actionbound
Actionbound (Figure 9) is a free to play game with a similar concept to last ones, although the big difference is that all tours are free and made by the public. Creators of the tours do not get money, the main difference between Actionbound and Questo. Since the tours of Questo cost money for users, the expected quality and process of making a tour is way more complicated compared to Actionbound. That means that there are way more Actionbound tours, but the quality is less insured. The disadvantage for playing free tours.
Geocaching
Geochaching (Figure 10) is an international initiative which is all about going on an ‘adventure’. It’s a free app where you get GPS locations of a ‘cache’ off all different shapes and sizes. If you find one you can write down your name in its notebook and sometimes even exchange random items. There’s millions of Geochaches all around the world and it’s free for everyone. There’s no commercial reason for the app so it’s fun for everyone.
Streetography
Streetography (Figure 11) is a city exploring app for photographers. It shows all the hot spots for the best photos and of each street/neighbourhood it has beautiful high quality photos of the surrounding to inspire photographers.
Pokémon GO
Pokémon GO (Figure 12) is the most popular exploration game. It’s less about showing people different (parts of) cities but more about collecting virtual characters. It uses GPS and you can only play the game by going out into the open and walk around.
Tripadvisor
Tripadvisor (Figure 13) is an extremely famous app in which tourists, locals and everyone else can look for fun activities, restaurants and masterclasses in certain cities. You can tell the app your budget, interests, location, type of activity and much more. It’s being used over the whole world and it even offers to make reservations for you.
| Name\Feature | For free | Personalized | Interactive | Educative | Local insights | Community driven | Guided online or in person | Offline device (direct approach) | Competitive | Inclusive (tourism/citizen) |
|---|---|---|---|---|---|---|---|---|---|---|
| Questo | no | half | yes | no | yes | yes | online | no | yes | yes |
| Enigmas tours | no | half | yes | no | yes | no | online | no | no | no |
| City game | no | half | yes | no | yes | yes | online | no | yes | no |
| Goosechase | no | half | yes | no | no | yes | no guided tours | no | yes | no |
| Actionbound | yes | half | yes | no | yes | yes | online | no | no | no |
| Geocaching | yes | no | yes | no | no | yes | no | no | no | no |
| Streetography | no | no | no | no | yes | yes | no | no | no | yes |
| Pokémon Go | yes | yes | yes | no | no | no | no | no | yes | no |
| Tripadvisor | yes | yes | no | no | yes | yes | no | no | no | yes |
| QRiocity | yes | yes | yes | yes | yes | yes | yes | yes | yes | yes |
Display market research
In Figure 14 there a wide array of different displays and kiosks that are available. Most public displays/screens are custom and have their own specific requirements. Most screen have been designed by design studios specialised in public displays. An example of a company like that is PARTTEAM & OEMKIOSKS which are based in north of Porto. They categorize different public display in 6 different categories.
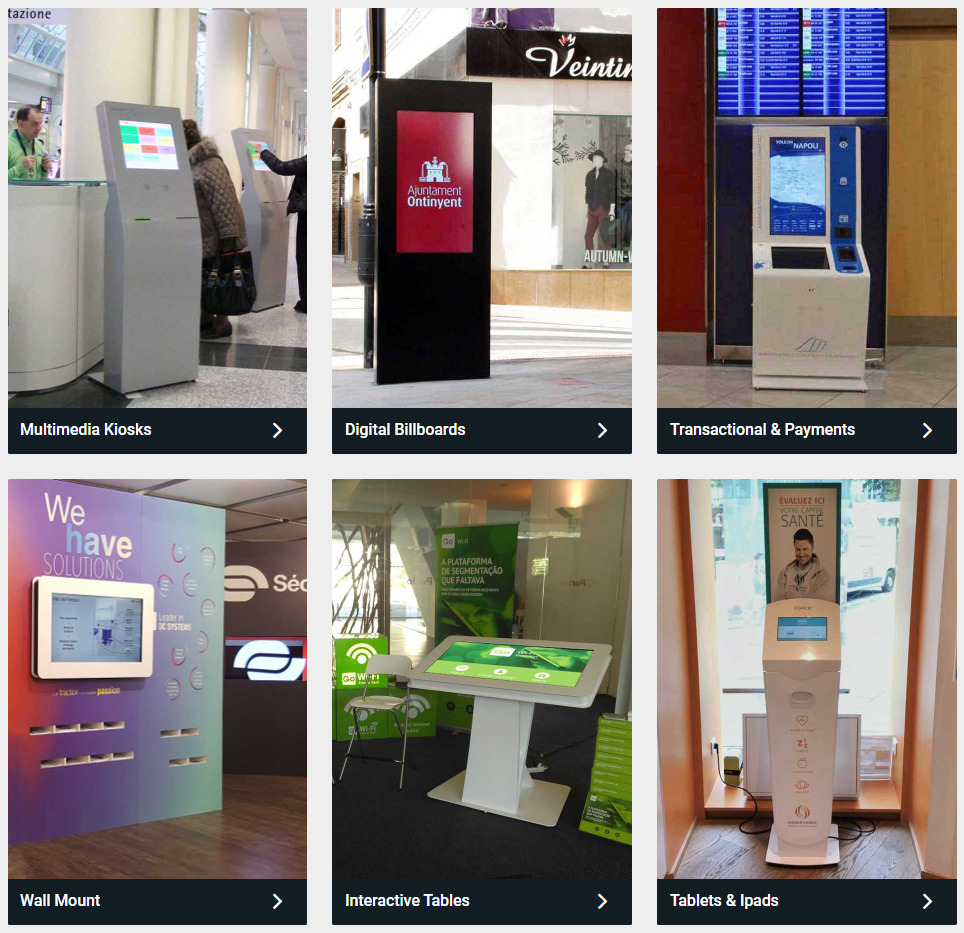
- Multimedia Kiosks
- Digital Billboards
- Transactional & Payments
- Wall Mount
- Interactive tables
- Tablets & iPads
The common features of the above are touchscreen, a waterproof design, sensors and NFC tags. There aren’t any public displays on sale, so there will be a display that needs to be designed ourselves.
4.3 SWOT Analysis
SWOT analysis is a useful and yet simple tool for developing a business strategy. The main purpose of the analysis is to identify the internal and external factors that are beneficial or detrimental to a company or product. SWOT analysis involves dividing the information gathered into four groups:
- S (Strengths) - anything that is an asset, an advantage;
- W (Weaknesses) - everything that constitutes a weakness, barrier, disadvantage;
- O (Opportunities) - everything that creates an opportunity for beneficial change;
- T (Threats) - anything that poses a danger of unfavorable change.
The use of SWOT analysis brings the entire team together, facilitates commitment to implementing the company's strategy, and promotes a shared awareness of key issues that affect performance. We decided to create two SWOT analyses - one for our team (Figure 15) and another to review our final product (Figure 16).


During our team's SWOT analysis, we noticed that despite our many weaknesses, we also have strengths that are significant. The most important strength is our diversity, which at the same time can be our weakness. The greatest opportunity for us is to gain experience and develop our skills, while among the threats we can distinguish stress and disagreement between team members.
While analyzing the strengths and weaknesses of our product, we discovered that it stands out among similar solutions in that it combines three important features - it is free for the user, educational, and fun. Among the weaknesses is that it may take some time to adapt our product to another city. As for the opportunities we have - our product is beneficial not only for the users but also for businesses that can promote by cooperating with us (local businesses can give discounts on products in exchange for advertising). As for the risks, the QR codes that are part of the solution are easy to destroy. In order to prevent QR codes from being destroyed, we decided to laminate the printed QR code. This will make it weatherproof and allow it to last for a long, long time. When our company starts to grow and the product will be implemented in more places, we will think about improving this solution to make it more eco-friendly.
4.4 Strategic Objectives
Strategic objectives are essential tools for operationalizing the desired movements of an organization. They are the company's goals in a broad perspective; they describe what the company will do to fulfill its mission and are the key to aligning strategy with process outcomes [Güldal Büyükdamgaci Alogan, Nüket Yetiş, 2006]. To define the goals of an organization well, the SMART technique can be used. It is a tool that helps to set goals in an effective and productive way. Specific and measurable goals determine the success of a project, achievable and realistic goals engage and motivate individuals, and time-bound goals ensure that all stakeholders are aware of deadlines [Chartered Management Institute, 2014]. Figure 17 shows SMART features.

Goals are “SMART” if they are specific, measurable, achievable, realistic, and time-bound.
- Specific - they specify exactly what is required.
- Measurable - includes a metric that allows to monitor of progress and determine when the goal has been achieved.
- Achievable - goals should be designed to be challenging, but achievable - knowing the existing limitations, time, and resources.
- Realistic - within reach, realistic, and relevant to the company goals.
- Time-bound - with a clearly defined timeline, including a starting date and a target date [Chartered Management Institute, 2014].
General mission and vision strategic objectives for our company:
Economical strategic objectives:
- Develop a business based around the tourism game; 1 customer (cities) till the product is fully developed.
- Attractive and understandable system (Connection between the screen and Web App); 10% of the people interacting with the screen start the game in the first month after placing the screen.
- Take a spot in the market by creating a reliable solution for tourism all over the world, starting from Porto, to contribute to the national economy by attracting new visitors.
- Create an engaging game; 10% of the people starting the game also finish the game in the first month after the game is available.
- According to statistics on the number of tourists in Porto in recent years, between 2015 and 2020, Porto has visited 13 million tourists on average, in 2020 the number was low, mainly due to coronavirus (it was 4.21 million), while given the improving situation, we can expect an increase in future years [Worlddata, 2021]. Assuming that 10% of tourists become interested in our solution (1.3 million people), and 10% of them actually participate and complete the game, we get 130,000 tourists per year.
- Contribute to the national economy by attracting visitors.
- Maintain growth based on the cooperation with local businesses; 2 local cooperations (1 restaurant, 1 city activity provider (ex. museum)) till the product is fully developed.
Customer/Learning strategic objectives:
- Educate tourists (individuals and groups) in a fun and interesting way about the city.
- Build relationships with local companies by cooperation with them; 40% of the people finishing the game use the voucher (information from partners about the number of used vouchers divided by the number of people finishing the game) in the first month the game is available.
Environmental objectives:
- Use as less energy as possible; measure when people interact with the screen (day/night/hours) and change the brightness of the screen regarding this and also the weather (if it is sunny or cloudy). Measure and test it in the first three months to implement changes fast.
- No waste regarding the packaging; after delivery and installation of the screen, 100% of the packaging be reused or if it will be damaged, it is made out of biodegradable material.
- Long duration of the public screen; 2 years without repairing the screen itself, 6 years without repairing the cover.
4.5 Strategy/Targeting/Positioning/Brand
4.5.1 Strategy
A marketing strategy is, by definition, a company's overall plan of action to reach potential consumers and convert them into customers for products or services. Among the elements of a marketing strategy, we can highlight the firm's value proposition, key brand information, and target customer data. A detailed marketing strategy includes “the 4 Ps” of marketing - product, price, place, and promotion (marketing mix), which will be described in detail in the next chapter [Adam Barone, 2022].
4.5.2 Targeting
A target market is a group of people with certain common characteristics that a company has identified as potential customers for its products. Identifying the target market is very important during the process of designing, packaging, and selling of product. [Susan Ward, 2020] During our work, we decided to focus on young people who feel the need to explore new places, experience new things, and enjoy them.
In our project, we distinguished two target groups:
- Users - young tourists, who will play the game, at age 18-40;
- Customers - the city authorities who will buy our product in order to accomplish their goals. We will focus first on cities, which are popular travel destinations (with at least 1 million tourists per year).
Based on our target groups, to structure our work, we prepared a problem statement and a value proposition for both groups.
4.5.2.1 Problem statement and Value Proposition
A problem statement is usually one or two sentences that explain the problem to be solved in a process improvement project. This is intended to help set the context and understand the significance of the research problem. This is extremely important in order to find and implement effective solutions [Shona McCombes, 2021]. Among the target groups of our product, we can distinguish two of them - the users who will play the game and the city authorities who are our customers. We prepared a problem statement for both groups, which is shown in Table 18.
| Problem statement | |
|---|---|
| Users | Businesses |
| Young tourists need a way to get the best experience out of their stay, but they are overwhelmed by the vast amount of possibilities while being limited in time, money and local insights. | Cities/municipalities need a way to easily attract new tourists, because existing tourism solutions are outdated. |
A value proposition is a single, clear statement that succinctly communicates the value a company creates in the world. It includes the primary reason why a customer should buy our product [MECLABS, 2021]. We've outlined the value proposition for users in Table 19 and for businesses in Table 20.
| Value Proposition for users | |
|---|---|
| FOR | young tourists |
| WHO | want to experience a city in an engaging way |
| THE QRioCity IS | a city exploration game |
| THAT | offers personalized tours to discover the local scene in a unique way for any group size |
| UNLIKE | (expensive) generic city tourism |
| OUR | game avoids tourist traps and introduces a competitive element |
| Value Proposition for businesses | |
|---|---|
| FOR | cities/municipalities |
| WHO | want to improve their tourism |
| THE QRioCity IS | a city exploration game |
| THAT | offers a maintenance free display promoting tourism |
| UNLIKE | outdated tourist information channels |
| OUR | display reinvents the way tourists explore your city |
4.5.3 Positioning
Positioning is about determining a product's place relative to others offering similar products and services in the marketplace and in the mind of the consumer [The Economic Times, 2022]. Based on the market research we performed earlier, we focused on mapping the competition that has the highest similarity with our product. We took into account two features - price (whether the product is paid for or available for free), and a feature that is very important to us - whether the product is entertaining for the user, if it is easy to use, if exploring a new city is as simple and interesting as possible for the user. In Figure 18 we presented a positional matrix.

4.5.4 Brand
A brand is a business and marketing concept that helps people identify a particular company, product or person. It is an important element that shapes the perception of a company and its products by potential customers [Will Kenton, 2022]. Below we discussed the specific elements of our brand - the name and the logo.
4.5.4.1 Name
We put a lot of effort into coming up with a name for our brand. The final choice turned out to be the name “QRioCity”, which consists of 3 important elements for us that define our brand well and represent our product.
The name consists of:
- “QR” - this is related to the fact that during the game users will use QR codes to cover new puzzles and to collect points.
- “CITY” - our product is a city game that allows you to discover a new city, expand your knowledge about it and have a great adventure.
- The pronunciation of the word “QRioCity” sounds like “curiosity”, which is an eager wish to know or learn about something.
Additionally, to emphasize these elements, the name is spelled as follows: QRioCity, which makes the abbreviation “QR” and the word “City” prominent and draws attention to itself.
4.5.4.2 Logo
In Figure 19 our logo design is presented.
Our logo consists of several important and meaningful elements, which are detailed in Table 21.
| Picture | Name of element | Description |
|---|---|---|
 | Name of game | Name of the game, which is connected with QR Codes and the term “City”, because it's a city game. Special color for QR, to highlight it's connected with QR codes. |
 | Shape of the city | Line which represents the shape of the city, can be personalized for different cities. |
 | QR Code | QR code. It will be connected with our website, but now, for the prototype, it is connected to our Wiki page. |
 | Path with footprint | Represents that this is a walking game, the user is playing the game by walking on foot, without using any public transportation. |
4.6 Adapted Marketing-Mix
In order to define the “marketing mix” we decided to use the 4Ps principle of marketing. It is a model that helps to define marketing options in terms of price, product, promotion and place, so that the offer meets a specific customer need. The 4Ps are constrained by internal and external factors in the overall business environment, and they interact significantly with one another [Mind Tools Content Team, 2019]. In Figure 20 elements of 4Ps are presented.

Product:
QRioCity is a product that addresses the tourism needs of city governments. Our product consists of a public display and a web application - a game. Thanks to our product, the city becomes more popular and newcomers are satisfied with the need to get to know the city in an interactive, fun and educative way. Our product consists of a game that is based on solving tasks, it also contains an element of competition, thanks to which the game is not boring. You can play it alone or compete with your friends. The public display will be placed in a place that is often visited by tourists and cannot be overlooked. Thanks to the built-in speaker our installation attracts the attention of passers-by and encourages them to check what the game is about. Users use it via smartphone, which nowadays most young tourists, to whom we address this solution, have. As we mentioned, our public display will be located in the center of a large city that receives at least 1 million tourists a year. Thanks to the cooperation with local companies, we will have the opportunity to offer users vouchers to restaurants, etc., and the companies will gain more customers and therefore increase their profits.
Place:
The public display will be placed in a popular downtown location that has a minimum of 1 million tourists per year. It must be an outdoor location that is sure to get noticed. Users open the web application by scanning the corresponding QR code displayed on the display, or they reach it directly from a search engine by typing in the address. City authorities can contact us through the website, where there will be a description of our activities along with the available offer. In the initial sales phase, we will have to rely on a promotional video made up of simulations, but once our solution has been implemented in a specific city, we will be able to base it on a real, profitable solution.
Price:
In the case of our project, there is no cost to the user for using the web application and playing game. And they will even gain - restaurant vouchers, etc. In the case of the city government, the cost of our service will be related to the purchase of public display along with service to maintain the product work. The authorities will pay us to keep the public display in good condition and to check its condition and make repairs. The exact price of the installation itself is not fully known, but the estimated value of monthly maintenance service is in the range of 20,000 - 30,000 €, and the cost of Public Display with installation service is 50,000 - 60,000 €.
Promotion:
In terms of promotion, we plan to maintain a website to showcase our services and any installations. Through the website, potential customers will be able to contact us. Since our solution can be applied all over the world, we plan to hold meetings with interested people first online to initially present the idea. To encourage tourists to use our product in a specific city, we plan to reach out using popular social media - Instagram and TikTok, which are incredibly popular with our target audience. We will definitely increase the promotion during the holiday season, when definitely more tourists go on a trip. Our leaflets informing about the initiative will be available in partner points (restaurants, cafes, etc.) and other popular points such as shops, restaurants, museums, touristic information points, etc..
4.7 Budget
A marketing budget determines how much a company should spend to promote its goods or services. It is important to determine what are the goals of the company and the optimal channels to reach the target audience. Budgeting marketing strategies help to avoid problems in the future [Marisa Sanfilippo, 2020]. In our case, we plan to conduct promotion through a website, which will mainly target potential customers - the city government. On this website, it will be possible to contact us and all the advantages and functionalities of our product will be presented. Once the product is purchased by the authorities of a particular city, we will take care of making it popular among young tourists visiting that city or planning a trip. Our product will be promoted on social media - TikTok and Instagram. According to the latest statistics, the largest number of users of both TikTok and Instagram is in our target group (18-40 years old).
Instagram:
- 13-17 years old: 8.5%,
- 18-24 years old: 30.1%,
- 25-34 years old: 31.5%,
- 35-44 years old: 16.1%,
- 45-54 years old: 8%,
- 55-64 years old: 3.6%,
- 65 years old and up: 2.1% [Stacey McLachlan, 2022].
Tiktok:
- 10-19 – 32.5%,
- 20-29 – 29.5%,
- 30-39 – 16.4%,
- 40-49 – 13.9%,
- 50+ – 7.1% [Brandon Doyle, 2022].
In Figure 21 graph of Instagram users by age is presented.

In Figure 22 graph of TikTok users by age are presented.

Additionally, as we mentioned previously, we intend to partner with local businesses on a barter arrangement. We plan to acquire partnerships by direct contact with businesses in a specific city. We will target places that are frequently visited by tourists - restaurants, museums, cafes, souvenir stores, etc. Through direct conversations, we will be able to discuss the amount and value of vouchers they can offer us in exchange for placing their logo on our promotional materials. Thanks to the fact that our product will be bought by the city authorities, we will be more creditable in the eyes of the companies and we should not have problems with gaining cooperation. We plan to distribute our flyers at partner locations. We plan to order 1000 flyers initially, and order more as needed, depending on the number of collaborations.
In Table 22, we have presented a summary of the expenses we will need to undertake for promotional purposes.
| Name | Units | Price [€] | Delivery/Additional costs [€] | Total cost [€] |
|---|---|---|---|---|
| 3-fold leaflet | 1000 | 81.18 | 11.28 | 92.46 |
| Website creation | 1 | 4000 | - | 4000 |
| Name | Price/month [€] |
|---|---|
| 500 | |
| TikTok | 500 |
| Hosting webpage | 40 |
4.8 Strategy Control
PDCA (Plan, Do, Check, Act) is a continuous management cycle used to continuously improve the quality and control of business processes. The application of this cycle is to standardize processes and find solutions that increase operational efficiency and financial effectiveness. The PDCA cycle influences team engagement because it logically shows where we are headed, what depends on what, if and how we influence what we do and what we have learned [Lean Partner, 2021]. Elements of PDCA cycle are presented in Figure 23.

For strategy control of our project we decided to use PDCA cycle, as we consider it very useful and helpful during work. It consists of the following elements:
- PLAN - In this phase, we do all the planning tasks. We need to determine what we need and if we have enough competencies in our team.
- DO - At this stage all the assumptions from the previous stage are implemented. Creating a product, the actual realization. In this phase it is likely that we will encounter additional problems that we have not thought of before.
- CHECK - In this phase, we check whether the performed actions were effective, whether the tasks are efficient and whether what we assumed was achieved. We learn by drawing conclusions and sharing our observations.
- ACT - Action is to decide what to do next. It depends on the outcome of the check. If the result is positive, the process can be standardized. If not, the problem must be reconsidered and the cycle repeated. We will adjust our work to the result.
By using PDCA correctly, we will achieve our goals and work as long as necessary to achieve a result that we are all happy with. It is also important to regularly monitor our strategy, to see if it is working, how it can be improved, and if it is actually producing the returns we expect.
4.9 Conclusion
In conclusion, in this chapter, we have defined our main goal and target group - users, which are young tourists aged 18-40, and customers, which are municipalities of popular destinations visited by at least 1 million tourists per year. Based on the market analysis, we decided to create a comprehensive solution for tourism, consisting of a public display and a web application. We decided on a public display that uses QR codes to redirect users to a web application displaying a game. Through SWOT analysis, we identified the internal and external factors that are favorable or unfavorable for our team and also for the product. After that, we focused on identifying our strategic goals for the product. We tried to make our objectives SMART, meaning specific, measurable, achievable, realistic, and time-bound. We divided the goals into 3 groups - economic, environmental, and customer/learning. We then looked at strategy, targeting, as well as market positioning, and our brand itself. We also developed a Marketing Mix using the 4Ps principle. Next, we addressed the budget, which is extremely important. After the analysis, we came to the conclusion that the best channel to communicate with the users of our solution would be TikTok and Instagram. Finally, we described how we will control our activities to ensure that we meet the marketing goals we set earlier. We decided to use the PDCA cycle, which allows us to make continual improvements and adjust our activities as needed at any given time. In the next chapter, we will focus on our main objectives related to eco-efficiency.
5. Eco-efficiency Measures for Sustainability
5.1 Introduction
Eco-efficiency is a concept that aims to achieve sustainable development, taking into account environmental impact. Eco-efficiency is the combination of the two words “eco” - economics and ecology, in order to combine the value of a product with the environmental impact. The primary goal of eco-efficiency is to increase the net value of a company/product/process and to achieve greater profitability using fewer raw materials or resources to reduce waste and pollution - “Do more with less”. This concept contributes to satisfying human needs and ensuring quality of life without impacting the environment and with minimum consumption of non-renewable natural resources.
Among the aspects to be taken into account when it comes to eco-efficiency are:
- Promote recycling of used materials;
- Reduce energy consumption by goods and services;
- Reduce the consumption of materials by goods and services;
- Minimize the release of toxic substances;
- Expand sustainable use of renewable resources;
- Help educate the public about natural and energy resource management;
- Maximize conscious use of renewable resources, promoting sustainability;
- Extend product durability [John R. Ehrenfeld, 2005].
Sustainable development is a doctrine of economics that assumes a quality of life at a level that current civilizational development allows. The Brundtland Commission ( the commission that aims to bring countries together to pursue sustainable development) released its final report entitled “Our Common Future,” which defines sustainable development as “development that meets the needs of the present generation without compromising the ability of future generations to meet their own needs.” The Commission successfully unified environmentalism with social and economic concerns on the world’s development agenda [McGill University, 2017].
The idea of sustainability is based on the constant search for balance between its three key pillars: social, environmental and economic (Figure 24).

Social Sustainability
Healthy communities have fair leaders who provide personal and labor security, and respect cultural rights. All people are protected from discrimination.
Environmental Sustainability
Ecological integrity is maintained when all of Earth's environmental systems are kept in balance; when natural resources are consumed by humans at a rate that allows them to replenish themselves.
Economic Sustainability
Communities around the world are able to maintain their independence and have access to the resources - both financial and others - that are needed to meet human needs [McGill University, 2017].
When developing a product, we want to maximize our ideas to achieve an innovative product that not only improves the quality of life for consumers, but is also eco-efficient.
5.2 Environmental
Environmental sustainability is about meeting the needs of present and future generations for resources and services without compromising the health of the ecosystems that provide them, i.e., as a state of balance, resilience, and interconnectedness that allows human society to meet its needs without exceeding the capacity of supporting ecosystems to continually regenerate the services necessary to meet those needs, or diminishing biodiversity as a result of our actions [John Morelli, 2011].
We can identify several guiding principles that we should follow to ensure environmental sustainability. We can distinguish several main categories: Societal Needs, Preservation of Biodiversity, Regenerative Capacity, Reuse and Recycle and Constraints of Nonrenewable Resources and Waste Generation.
- Societal needs - Don't produce anything that would require future generations to be vigilant; Design products/services that contribute to more sustainable development; Support local employment and fair trade
- Conserve biodiversity - Choose raw materials that maintain the biodiversity of natural resources; Use environmentally responsible and sustainable energy sources and invest in improving energy efficiency
- Regenerative capacity - Maintain harvest levels of renewable resources within the regenerative capacity of the natural system that produces them; keep the rate of depletion of nonrenewable resources below the rate at which renewable substitutes are developed.
- Reuse and recycling - Design with reuse and recycling in mind and think of processes as closed-loop systems that reduce emissions
- Limitations associated with non-renewable resources and waste generation - Keep waste emissions within the assimilative capacity of host ecosystems; develop transportation criteria that will have a low environmental impact [John Morelli, 2011].
Our product has an environmental impact that we have tried to minimize as much as possible when selecting materials and designing the unit. For the transportation of our public display, we will use a fitted form that can be reused; moreover, the material from which the protective packaging is made is mycelium, an eco-friendly material that is produced from agricultural waste and mushrooms/fungi. Moreover, since the offered service contains a public display which consumes energy, we decided to use solar panels to minimize the negative effects on the environment and provide the energy to operate.
5.3 Economical
“As mentioned in the introduction, both sustainability and eco-efficiency have an economic dimension. Economic sustainability refers to the economic performance and its continued existence. Economic goals concern, for example, improved competitiveness or profitability” [Cornelius Moll, 2019]. “Eco-efficiency offers a number of economic benefits, such as Government of Canada:
- Reduced costs through more efficient usages of energy and materials
- Reduced risk and liability by “designing out” the need for toxic substances
- Increased revenue by developing innovative products and increasing market share
- Enhanced brand image through marketing and communicating improvement efforts
- Increased productivity and employee morale through closer alignment of company values with the personal values of the employees” [Lidija Čuček, Jiří Jaromír Klemeš, Zdravko Kravanja, 2015].
For our solution, we paid special attention to the economic part of the solution. When designing the public display, we focused on maximizing the use of renewable and biodegradable resources. We did not achieve a 100% green solution, but most of the materials are recyclable and repairable. For the packaging, we were able to find a solution that uses only biodegradable material. We will try to reuse the packaging as much as possible, but if it is damaged, it is a biodegradable material, so we will not have problems with disposal. We also focused on the durability of our product. We have done a simulation so that we can be sure of the durability of Public Display against weather conditions etc, so it will be a solution for many years.
5.4 Social
“Sustainability differs from eco-efficiency in considering social aspects. Social sustainability aims at a fairer and more appropriate social system to increase well-being, health, wellness and social equity” [Cornelius Moll, 2019][V. N. Amrutha, S. N. Geetha, 2020]. “Concrete measures for organisation and its employees in connection with a product or service can address issues such as better working conditions, development opportunities or an increased quality of life. When it comes to measuring social sustainability there are several criteria which should be taken into account: “self-determined life and mixed work; satisfaction of basic needs; reliable and sufficient security system; equal opportunities, participation, democracy; social innovations; intergenerational equity; objective and subjective basic needs; objective and subjective social resources; objective and subjective equal opportunities; subjective participation; objective sustaining oneself; cultural diversity; and solidarity and tolerance” [Gregor Schönborn, Cecilia Berlin, Marta Pinzone, Christoph Hanisch, Konstantinos Georgoulias, Minna Lanz, 2019]. In terms of the value of the three mutually influencing sustainability dimensions, a weak and a strong understanding of sustainability differ. A weak understanding of sustainability is dominated by economic action and relates primarily to the efficient use of resources and the reduction of environmental impacts within predefined, economic guidelines. In contrast, in a strong understanding of sustainability, the economic, ecological and social components are equally important” [Cornelius Moll, 2019]. As a company, we can take social action at the level of our employees and in relation to our customers. When it comes to employees, it simply comes down to treating everyone fairly and equally. Good and safe working conditions should always be ensured, as should decent salaries. In addition to respecting and applying human rights, we want to ensure and promote gender equality and diversity in the workplace so that employees feel comfortable In terms of user experience, we want our product to be intuitive and easy to use. The product will be in the language that most young tourists visiting a new country know - English.
5.5 Life Cycle Analysis
Life Cycle Analysis (LCA) is the evaluation of the environmental effects of a product or service over its entire life cycle. The life cycle includes raw material extraction and processing, manufacturing, distribution, use, recycling, and final disposal. It aims to reduce the negative impact of a building on the environment, promote conscious resource management, and support a design process with particular concern for occupant comfort and the environment [Science Direct, 2022]. The entire life cycle can be divided into six different stages, from raw material use to recycling. A graphical concept of this structure is presented in Figure 25:

Our goal during the project is to create a solution for tourism, which will allow young visitors to get to know the city in an interesting and engaging way and will make the city perceived as more attractive to tourists. We design a game, a web application along with a public display that attracts attention and encourages interaction. We are focusing on people who are 18-40 years old, and we will sell our product to the authorities of cities with at least 1 million tourists per year. In terms of sustainability, we want our product to be first and foremost durable and resistant to damage so that it will not need to be replaced frequently. We also focus on using materials that are biodegradable or recyclable.
Raw materials
In order to achieve the best level of recycling in our design, we need to use materials that are recyclable, renewable, non-toxic, and pose no risk to the environment. When it comes to electronic components, we try to reduce their emissions as much as possible, starting with the use of a solar panel as a power source, and trying to choose the greenest components possible. For the public display, it is important that the material has high tensile strength, that it can withstand the impact of people trying to destroy the product, and that it can withstand the weather since it is in a public space, outdoors. We decided to use Aluminum 5182, H19 [AZ Materials, 2013] for the public display because it has very good strength. Moreover, it is also the most recycled, and recyclable, material in use today. Recycling is a critical part of the modern aluminum business. Making recycled aluminum consumes only about 5% of the energy needed to make new aluminum - reducing carbon emissions and saving money for companies and end consumers [The Aluminum Association, 2021].
Manufacturing
The overall goal of this step is to minimize the environmental impact during production. The production process should be limited to as few elements as possible. The efficiency of optimized production methods and operations can be continuously improved by reducing production steps. In a company, sustainable production not only produces more balanced products but also increases social and environmental benefits. Of course, it is extremely important to ensure employee safety by implementing proper working conditions. Another issue is educating our employees so that they have the right skills and do not use too much material unnecessarily.
Packaging
Our product packaging achieves optimum sustainability levels through minimal use of materials. It is created from mycelium, a material made from agricultural waste and mushrooms, meaning only natural components. Our packaging is designed so that it can be reused in the same purpose, to transport the next public display. If it is damaged and no longer suitable for further use, it can be safely disposed of as it is a biodegradable material. All in all, it is a beneficial, safe and eco-friendly solution. Consequently, being more sustainable and using environmentally friendly materials can help us attract more customers and increase their loyalty. Numerous studies have shown that consumers are interested in sustainability factors when choosing the brands they want to work with.
Distribution
The distribution of our product will be done overland to get the public display to its destination safely and quickly. The choice of the specific mode of transportation will depend on the distance of the city from the production facility.
Use
The design of our product has been engineered to be as long-lasting and durable as possible. Since the product is exposed to the weather, as well as the possibility of vandals destroying it, we focused on making the material strong and hard to break down. The built-in solar panel allows us to make the best use of energy to operate the kiosk.
Disposal
In the case of our solution, we tried to use such solutions to not create new wastes but mainly use recyclable materials. The aluminum of which the public display is made can be recycled into other products. Components such as the distance sensor or the speaker can be replaced without the need of replacing the entire public display. We have tried to create a solution that will last a long time without needing repair, thus minimizing the environmental impact.
5.6 Conclusion
Sustainability should be the keynote of the whole project. It is a very important factor that we have to take into account during the implementation of our project. We will develop our product always keeping in mind the three pillars of sustainability - environmental, social, and economic. We will try to minimize our impact on the environment. When it comes to our community, we want to be transparent in our actions and establish positive relationships with our users. It is also important that we have the support of our employees. From an economic point of view, we will try to make efficient choices that will benefit not only the environment but also our company. Our goal is to design public display in such a way that it will be durable and will not need repair for a long time, and after its life, specific components can be easily recycled.
In the next section, we will take a closer look at the ethical and deontological issues associated with our product.
6. Ethical and Deontological Concerns
6.1 Introduction
In this chapter, we will see Ethical and Deontological concerns. We will start by defining the terms in introduction. Then we will study how our product respects the different areas of ethics. We will see engineering ethics, sales and marketing ethic, environmental ethic and liability.
“In deontological ethics an action is considered morally good because of some characteristic of the action itself, not because the product of the action is good. Deontological ethics holds that at least some acts are morally obligatory regardless of their consequences for human welfare.” [The Editors of Encyclopaedia Britannica, 2020]
Ethics and Deontology are two very important concepts to take into account when creating a product or service. Indeed, every new thing must be able to respect the moral rules that govern our society. It is therefore necessary to ban from the solutions envisaged anything that could physically or morally harm someone, to try to include the maximum number of users without discrimination.
6.2 Engineering Ethics
In this chapter, we will look at the ethics of engineering. Each country in the world has its own code of ethics, and even more so each profession has its own rules of ethics. However, the main guidelines are the same and are part of everyone's education. Some examples are: telling the truth, being good to others, not cheating or doing things that we know are wrong to others.
What about engineering?
“Ethics are principles followed depending upon the moral responsibility that a person feels. The study of related questions about moral ideals, character, policies and relationships of people and organizations involved in technological activity, can be termed as Engineering ethics” [Tutorials Point, 2017].
An engineer must therefore make ethical decisions because what he creates and produces will have a significant impact on people's lives and safety. The aim being that this impact should be positive, the product or service created must be safe so as not to harm people or at least not to have the vocation of harming the user during use. Furthermore, the engineer must behave ethically in relation to the world around him or her and therefore mainly the environment. Today it is important to avoid creating something that is too polluting, too expensive or inaccessible.
6.3 Sales and Marketing Ethics
As a company we have the ethical obligation to not discriminate any groups of people in our marketing. This means that if we are going to use images as marketing, it’s important to include people of all ages, ethnicity and genders. Indeed, we have designed our product to be sold to public services (municipalities, tourist offices, etc…) which will themselves exploit it as a service. The final users of our product will therefore benefit from this service free of charge, which will allow a cultural and tourist opening of the city without distinction of social class.
When it comes to selling our service, we have two main obligations towards municipalities. The first is to accompany and be transparent with the customer during the sale, i.e. to give them all the information about the product they need (the price of the product, the cost of its installation, maintenance, performance and operation). The second is to take care of our products as much as possible and to make sure that the city will always have the service it pays for.
Finally, in order to maintain the company's sustainable growth, we set clear but realistic sales targets to avoid bad marketing behaviour.
6.4 Environmental Ethics
As a company we have a duty to be transparent about the energy consumption of our product and the recycling of the materials we use. Our aim is to have the minimum impact on the environment by using biodegradable, recyclable or reusable materials wherever possible.
Today our product is not yet perfect from an environmental point of view because we do not yet have all the technologies necessary to have zero environmental impact, but we are an innovative company and we are always looking to improve our products and equip them with the least polluting components possible.
We have to pay attention to the use of the product but also to its production, the choice of raw materials, its delivery and finally its end of life. In order to address these issues we decided to use recyclable materials (aluminium), repairable and reusable materials (screen, electronic components), biodegradable and reusable materials for packaging (mycelium, more details on Chapter 7.5) and finally solar panels to reduce the consumption of electrical energy from the city.
6.5 Liability
Liability is the state of being legally responsible for something. Moreover, being legally responsible implies respecting the law from a personal or organisational point of view.
Let's take an example close to our case. If the kiosk catches fire due to a design error, we, as the design company, are fully responsible. Responsible for the kiosk itself but also for the damage it may have caused to others. Even worse, if this design error is conscious and was made in order to save money for example.
It is for this reason that the company must establish a contract that implies the legal commitment of both the client and our company. Both parties must respect the contract and the laws in force in the country where the product is sold and in the country of manufacture, if different. Furthermore, if the company is unable to respect one of the clauses of the contract at a given moment, it must, in an ethical approach, compensate the customer as best it can. In the event of damage, the company must establish the cause of the problem in order to avoid a recurrence.
In terms of ethics, the company cannot afford to be negligent in the maintenance of the kiosks and must always ensure that the customer has the service he is paying for in working order. If this is not the case, it can repair the product, restore it or reimburse its customer for the inconvenience caused.
As a company we have to follow the following guidelines:
- Machine Directive [European Comission, 2017] because we have interchangeable equipment such as the screen or electronic components in case of failure,
- Electromagnetic compatibility [European Comission, 2017] because our device could be disturbed by an electromagnetic field,
- Radio Equipment Directive [European Comission, 2011] in case of radiocommunication,
- Restriction of Hazardous Substances in Electrical and Electronic Equipment Directive [European Comission, 2011]
Last but not least, the company must respect its own code of ethics, which we have described earlier in this chapter.
6.6 Conclusion
Based on this ethical and deontological analysis, the team chose:
- A safe design for both the user and the maintenance operator who will work on the product,
- A responsible and supervised sales method to avoid any bad commercial behaviour,
- Materials whose production, use and recycling have the lowest possible environmental impact,
- Repairable and reusable components,
- To take responsibility in case of problems.
In the next chapter, we will look at the different stages of project development.
7. Project Development
7.1 Introduction
After analyzing all the previous chapters and considering all the features and strategies proposed for product development, in this chapter we will present the evolution of the product and its design, from the first sketch to the final product. Our main goal is to find a suitable public kiosk design that will be interesting to the user, attract their attention and encourage them to play. Once the product is completed, all functional tests and preliminary simulations will be performed.
7.2 Ideation
Our idea was to combine a public kiosk/display along with a web application that the user will use on their personal smartphone. Figure 26 shows our idea. The user's attention will be caught by the public display and there the service will be introduced. The built-in sensor will detect that a person is in front of the screen and will change the image to encourage the user to interact. The user will use their phone to enter the game and start exploring the city. The public display will be powered by solar panels and energy will be stored in a battery.

7.2.1 Black Box Diagrams
A black box diagram is especially focused on the input and output of a system. A black box model receives inputs and produces outputs, but its performance is unknown. Black box models are increasingly used for decision making in financial markets. Advances in technology, especially in machine learning, make it impossible for the human mind to accurately analyze or understand how black box models produce their conclusions [Will Kenton, 2022].
Figure 27 shows the BlackBox Diagram for Public Space:

Figure 28 shows the BlackBox Diagram for WebApp:

7.2.2. First design sketches
The first design sketches of the public display,that have been made can be seen in Figures 29, 30 and 31. Figure 29 are the main first ideas and a collection of a few ideas. Figure 30 is one of the better ideas, it's a classic clean design and will have wooden legs on the side. The design is a little generic and since the screen has to grab attention, a more 'funky' design has been made too. The design is based on a water drop, but upside down. If you look at the screen from the site, it's an exclamation mark to grab attention. This can be seen in Figure 31.
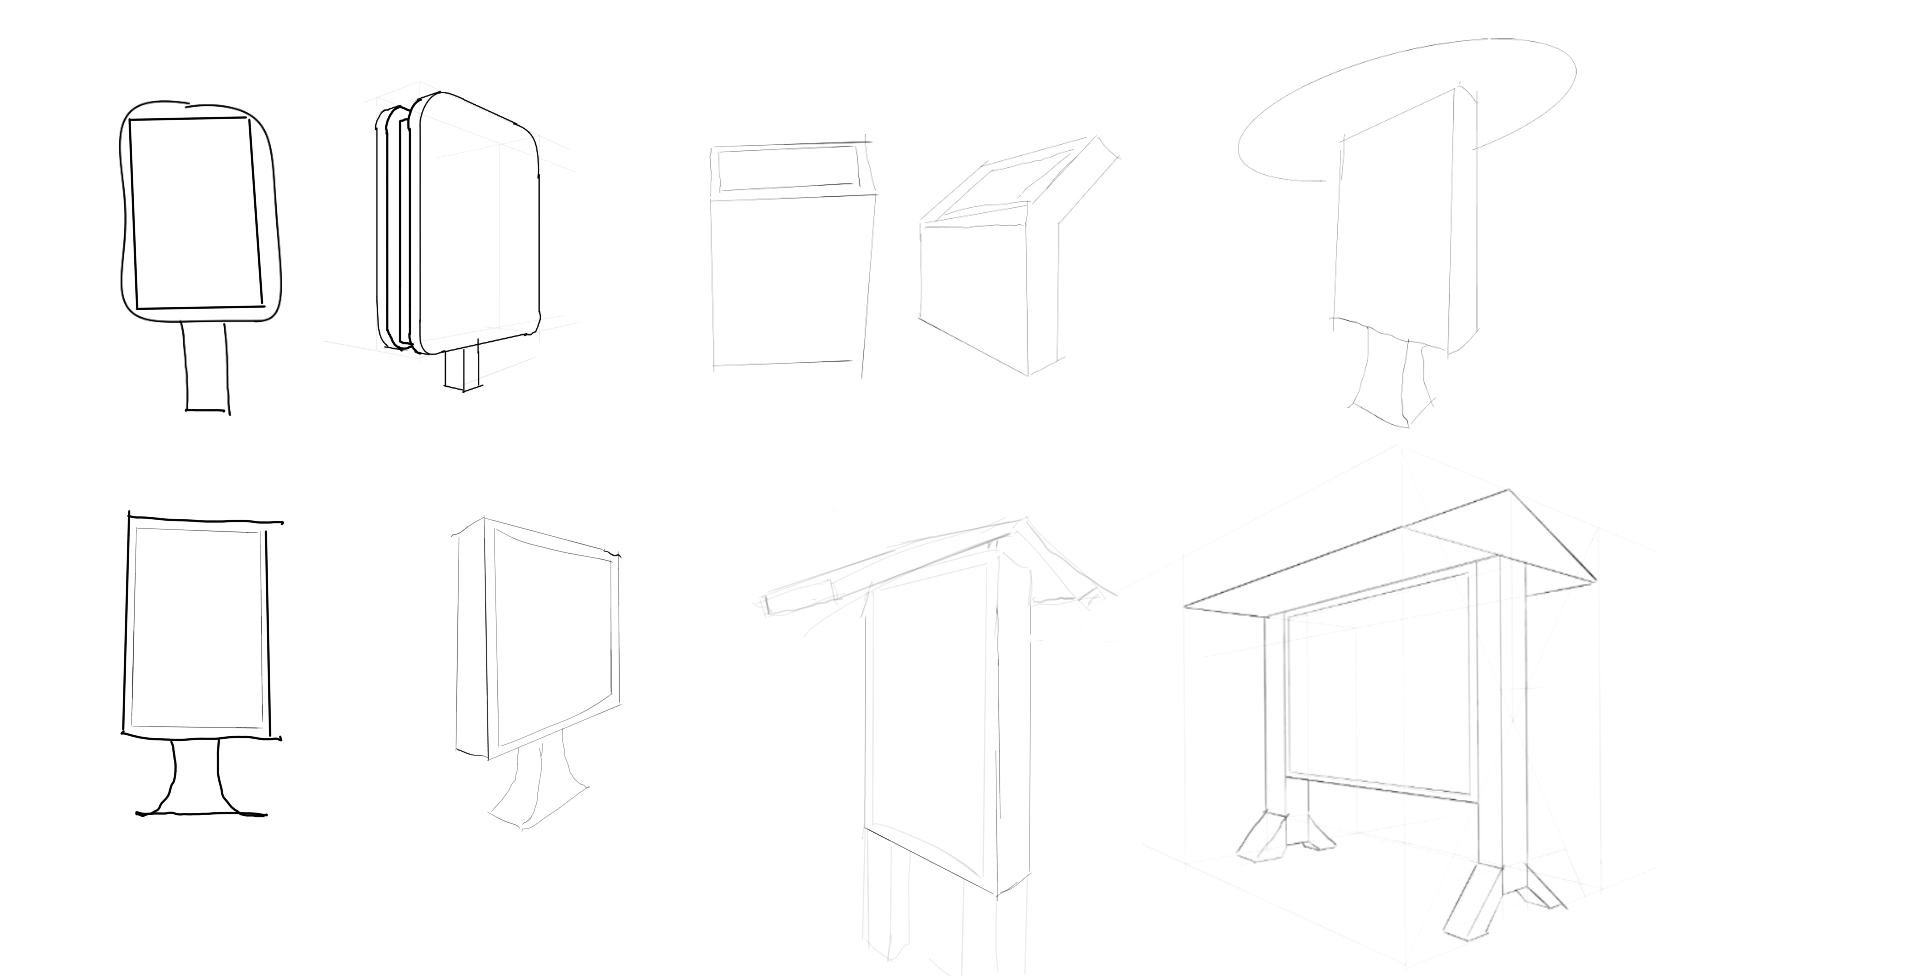
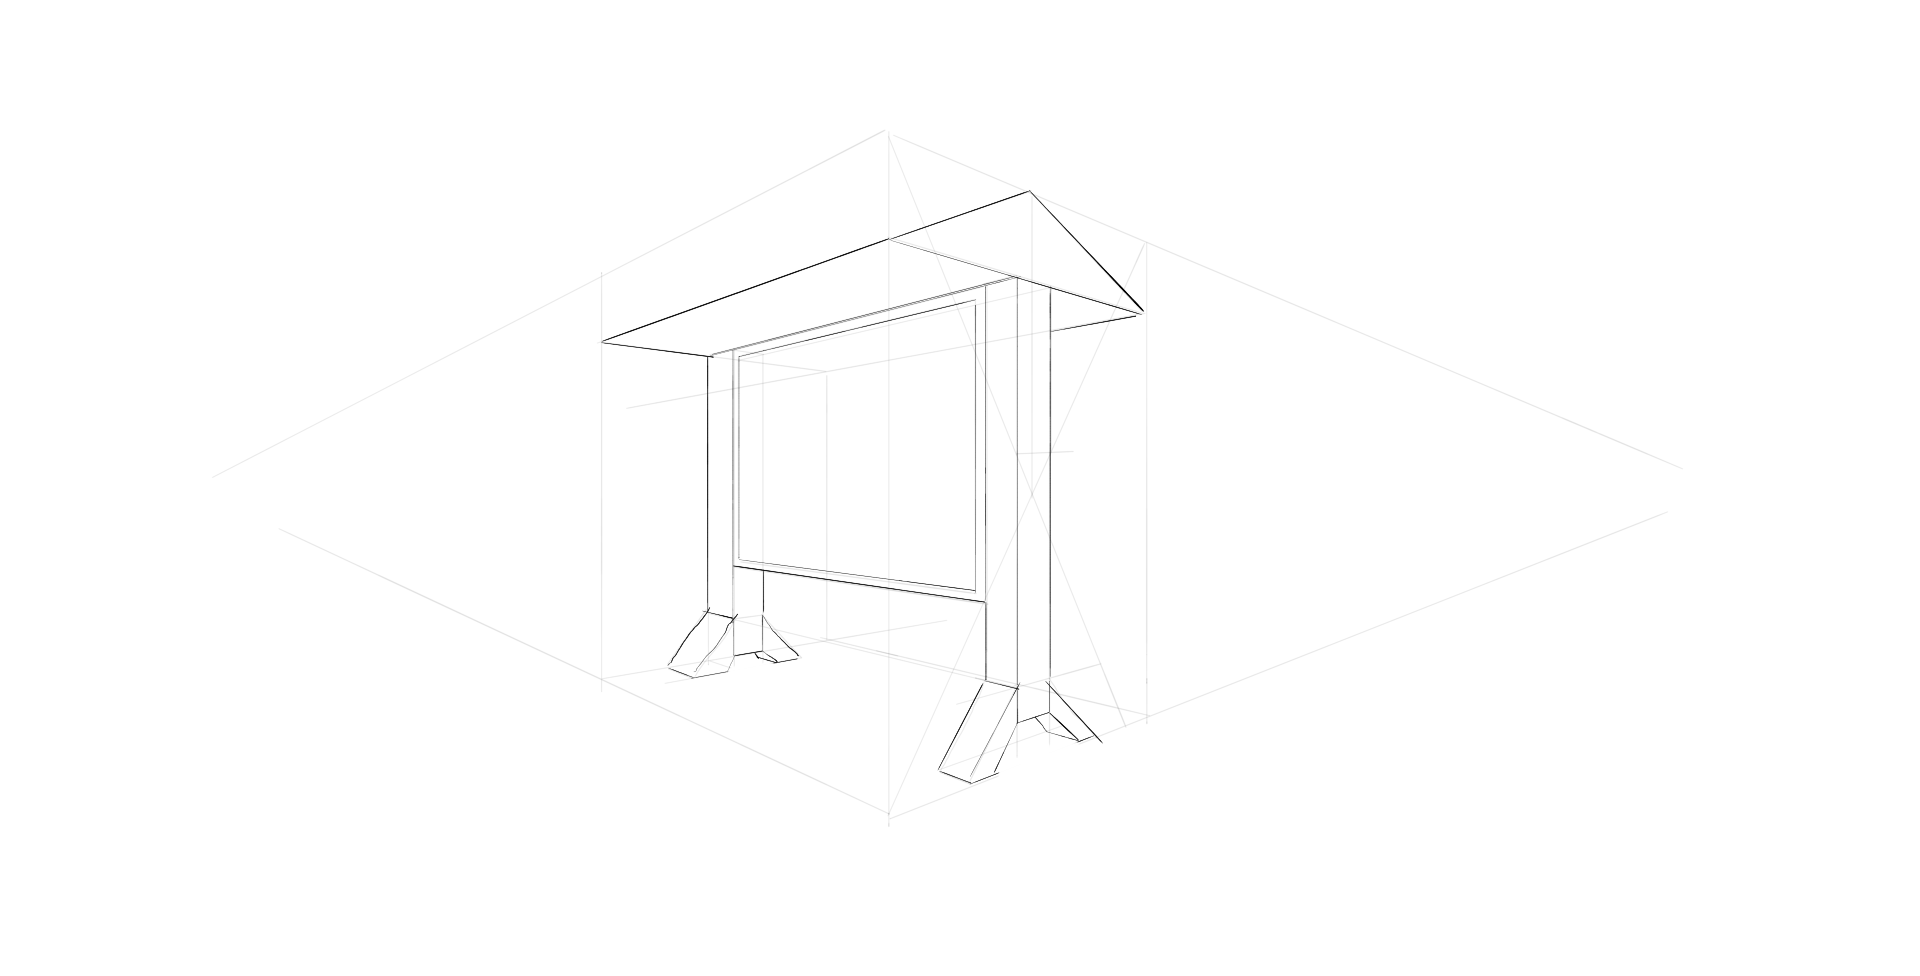
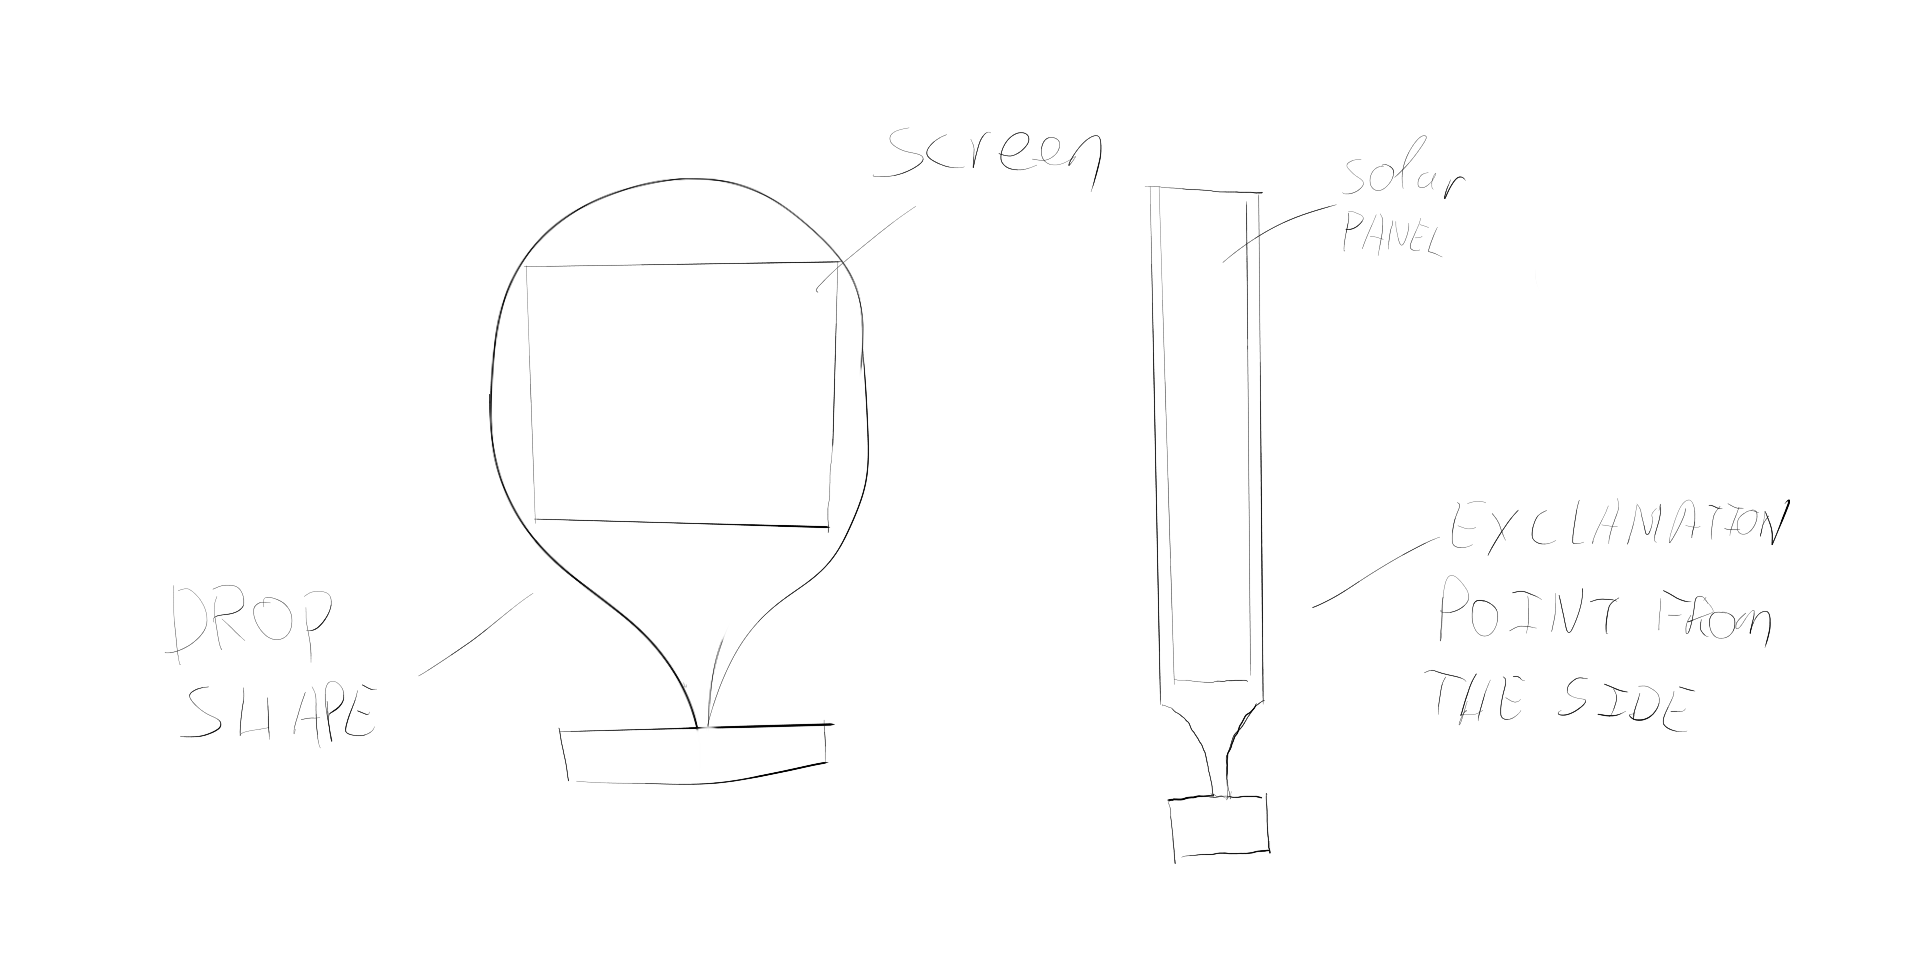
7.3 Concept
In this chapter we will present our logo and the functionalities of our kiosk and web app.
7.3.1 Logo
In Figure 32 our first logo design is portrayed which only includes the scannable QR code but not any other elements of our branding or project, therefore some redesigns were created and our final design was chosen, depicted in Figure 19. The QR code is still present and it additionally includes hints to city, curiosity and a small tour.

7.3.2 Functionalities
We have analyzed and highlighted the most important functionalities that our products should have. The list of functionalities for Public Display is presented in the Table 23, and for web app - in the Table 24.
| Functionalities of Public Display | |
|---|---|
| 1 | Displaying possible routes |
| 2 | Giving information about game |
| 3 | Display QR code to enter game |
| 4 | Makes a sound to attract attention when someone passes by |
| 5 | Can play different sounds |
| Functionalities of Webapp | |
|---|---|
| 1 | Scanning and understanding QR Codes |
| 2 | Giving information about tasks/questions/points |
| 3 | Giving information about success or failure in doing task/answering question |
| 4 | Measuring/showing time |
| 5 | Counting points |
| 6 | Giving clues/help |
| 7 | Possibility to skip the tasks |
| 8 | Possibility to obtain voucher after game |
| 9 | Storing information when phone is closed |
| 10 | Game can be stopped at any time |
7.4 Structural Design
Structural design is an analysis of the structure of the object. This analysis allows us to check the stability and strength of our object.
In Figure 34 the first version of the public kiosk can be seen.
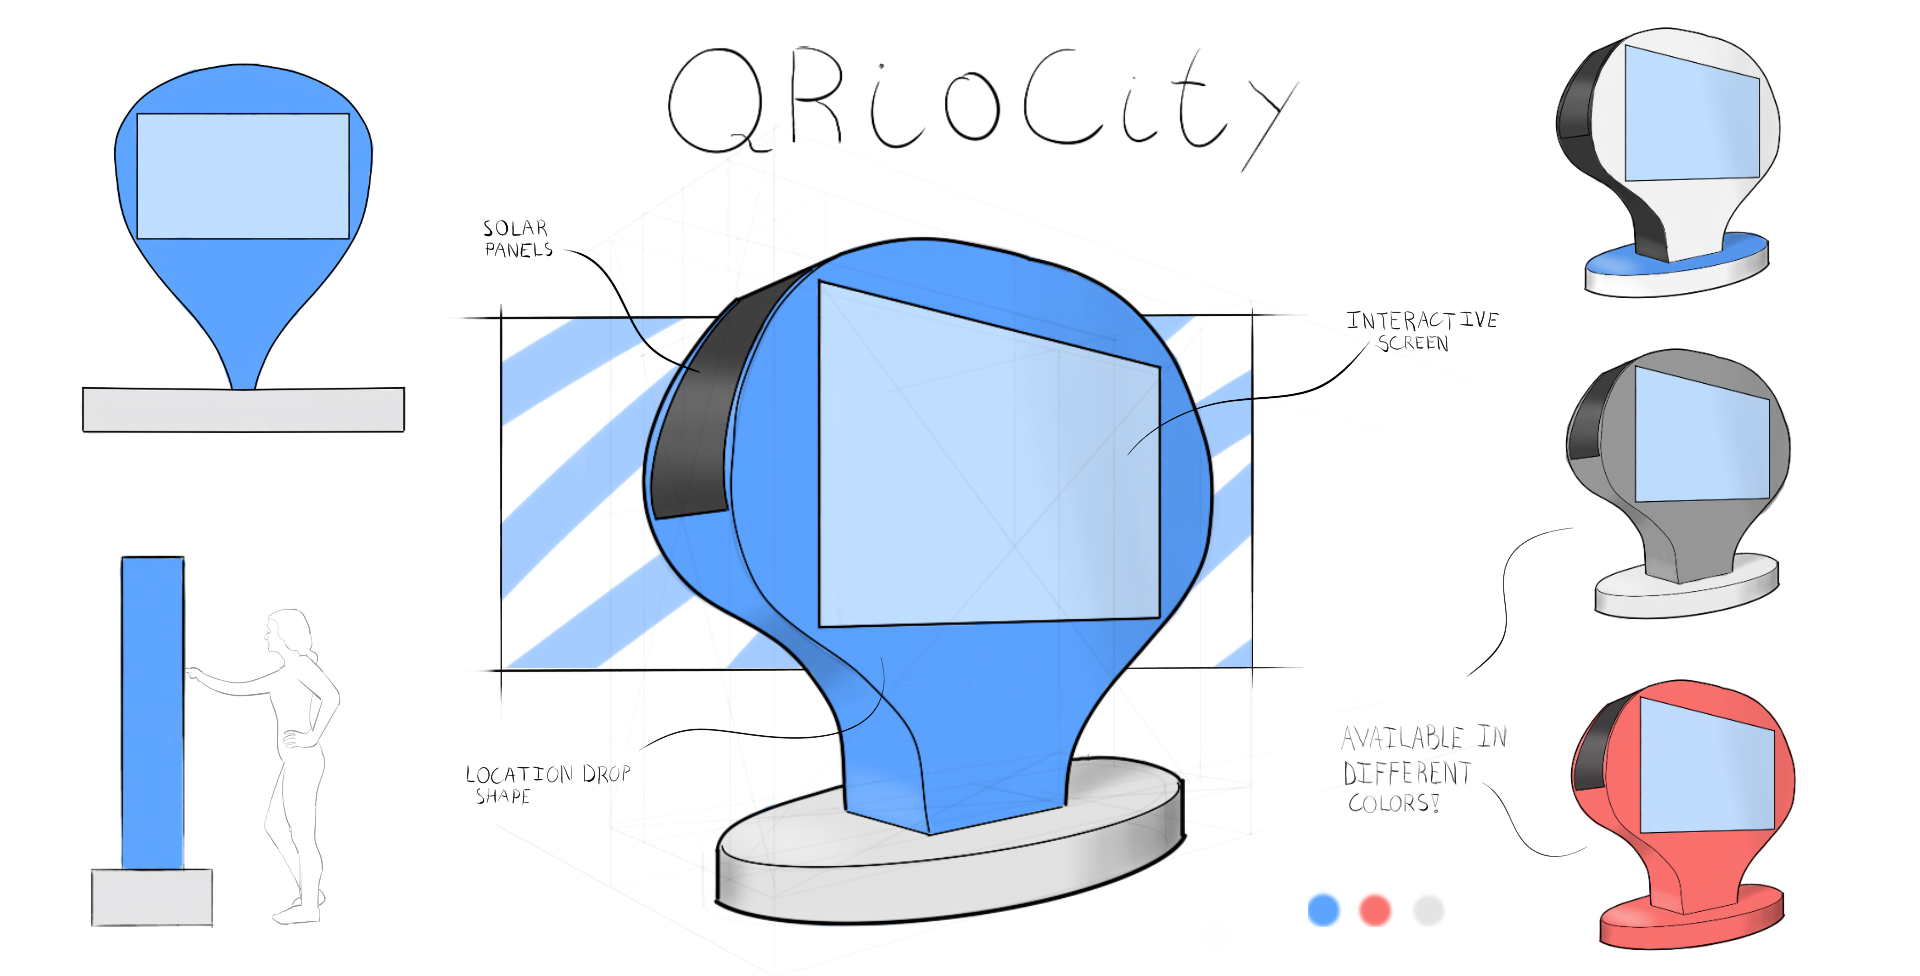
In Figure 35 the first 3D proposition can be seen.


Second design After reviewing this design and some feedback about it, there's been a second version of the design. This design can be seen in Figure 36
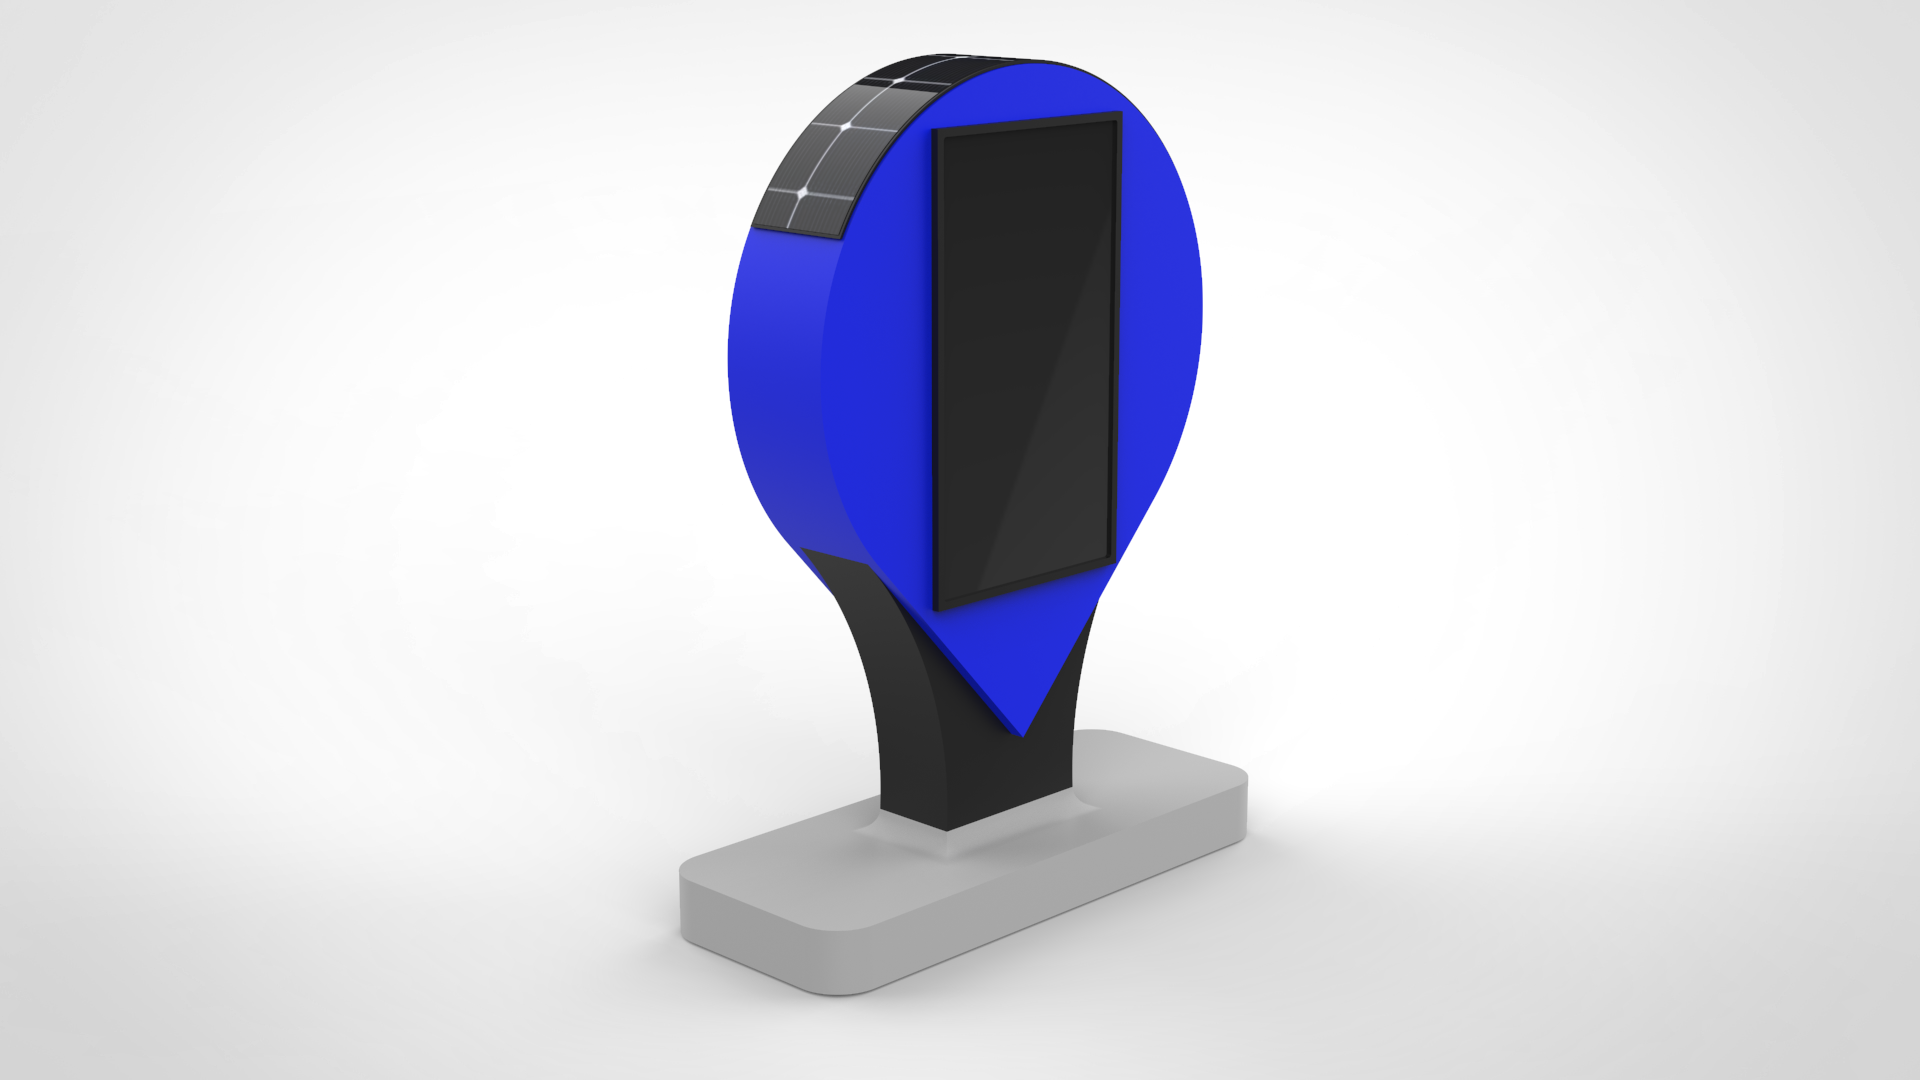
Figure 37 depicts the detailed structural drawings with dimensions.

Materials and simulations In order to make the stress and strain simulations, we need to first look at what materials would be most suited for the design. Looking at the shape, the best way to produce it is to split up the model in three different parts. A top part and a bottom part. The bottom part will then again be split up into two different parts. Figure 38 shows what this looks like.
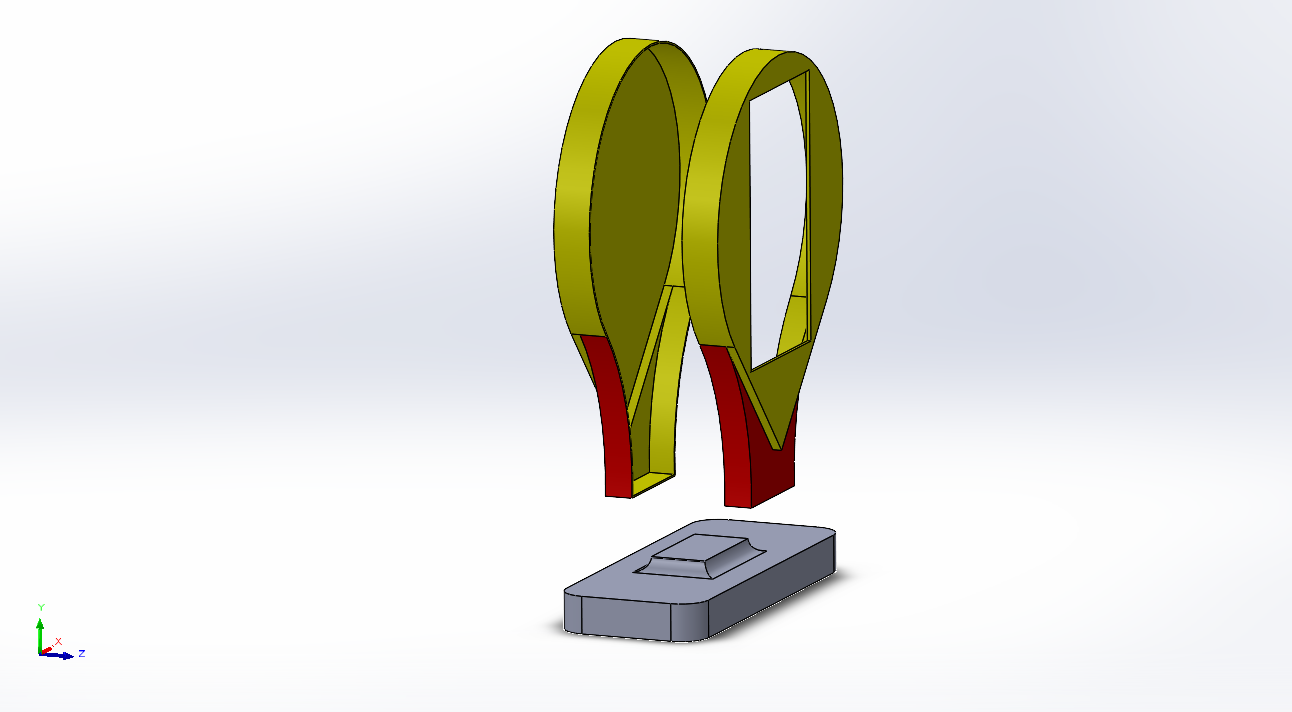
This way the three parts can be produced by press forming. Press forming is a production method that works well together with aluminium. A material which is suited for this product for its properties and price. In GRANTA Edupack there’s a few tools in order to pick out which material is most suited. For our material, it’s important that it has a high tensile strength in order to resist impact from people trying to destroy the product since it’s located in a public space. If we put all the different materials in a graph with density on the x-axis (since we want to make the product as light as possible) and tensile strength on the y-axis. We get a result which can be seen in Figure 39.
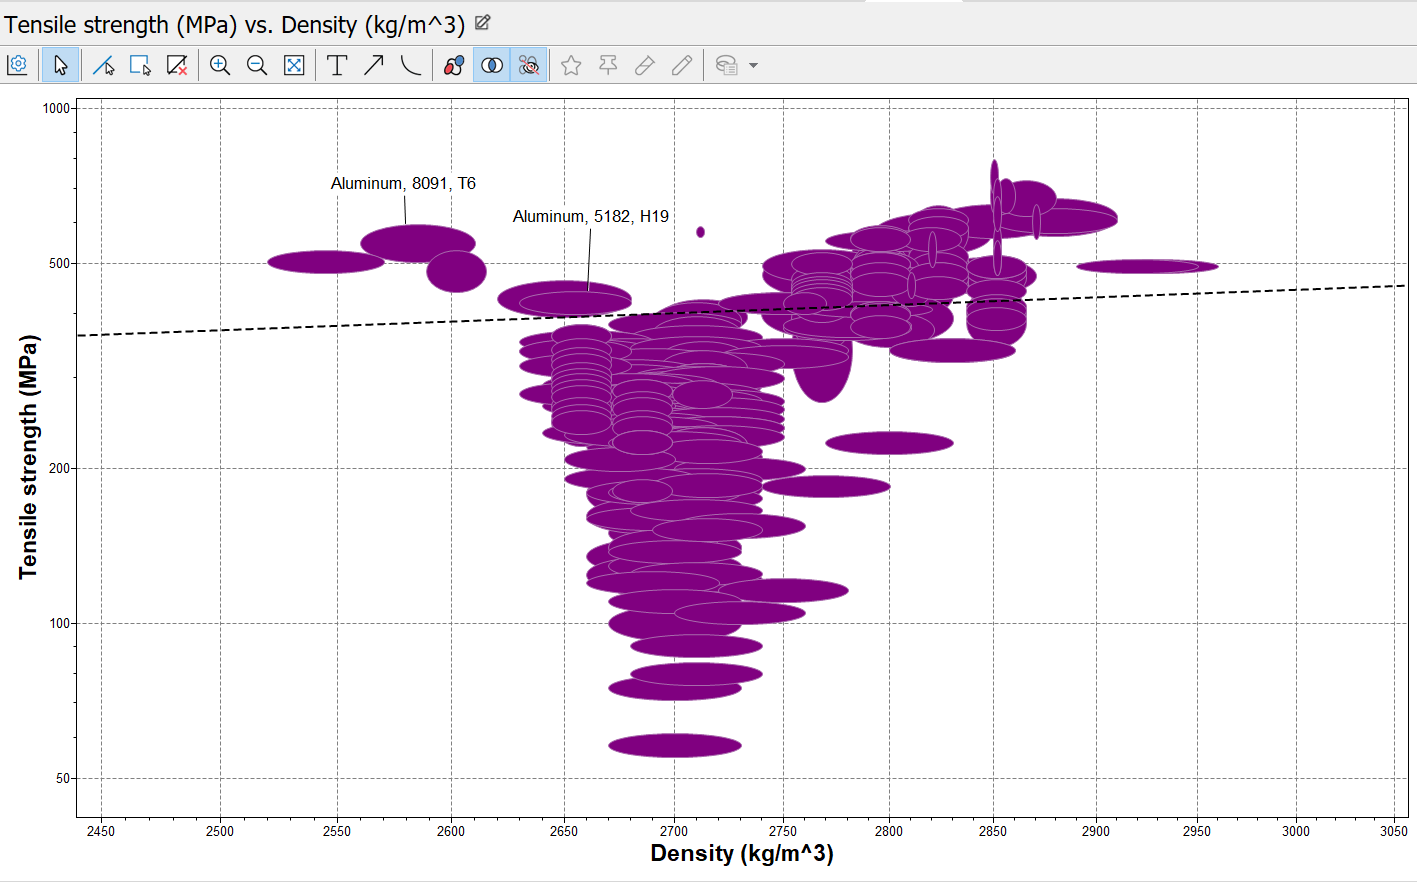
The two materials that seemed to be most suited were Aluminium, 8091, T6 and Aluminium 5182, H19. In Figure 40 and Figure 41 the different attributes of both materials can be seen.
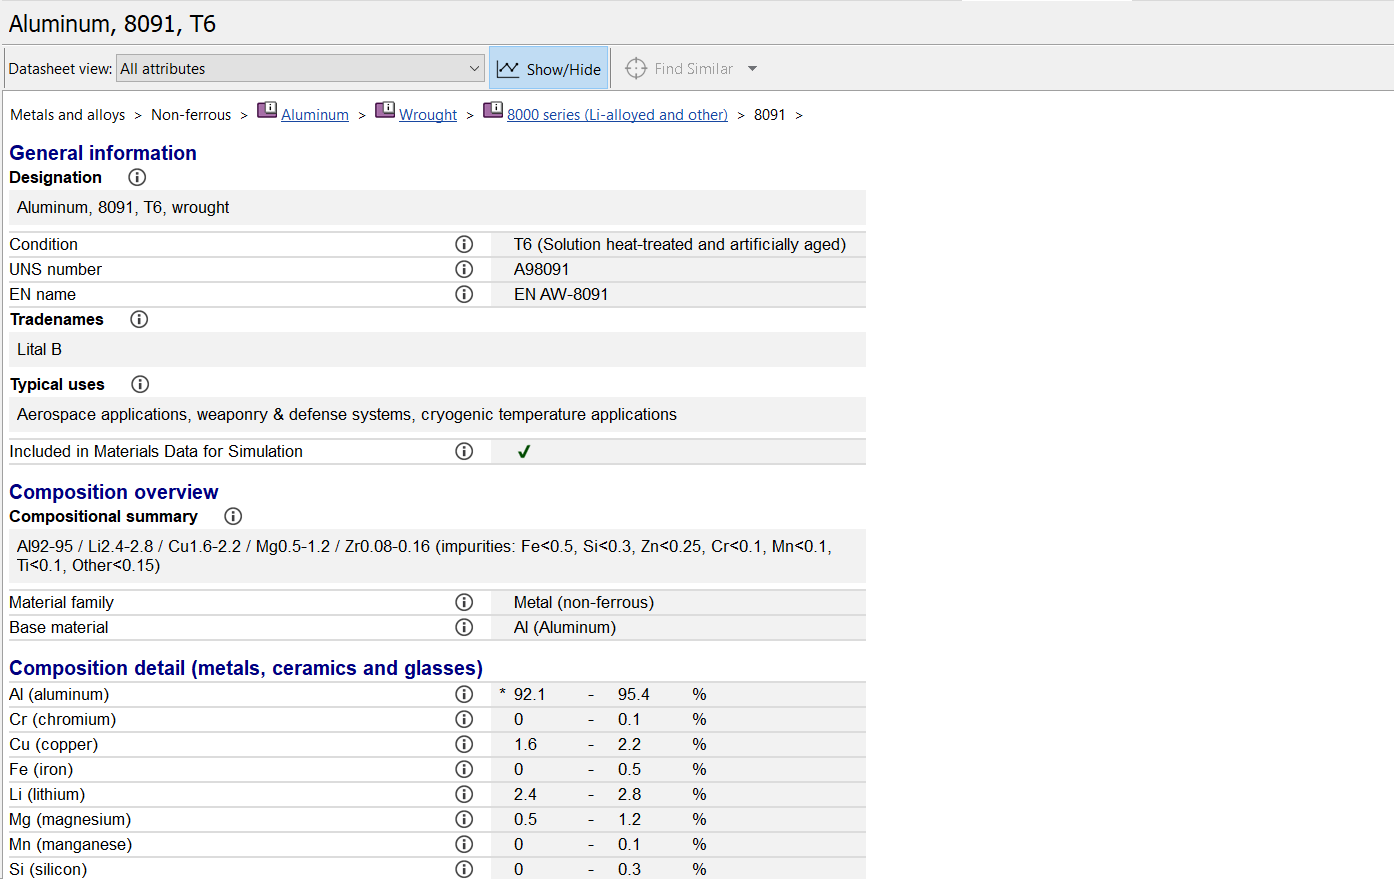
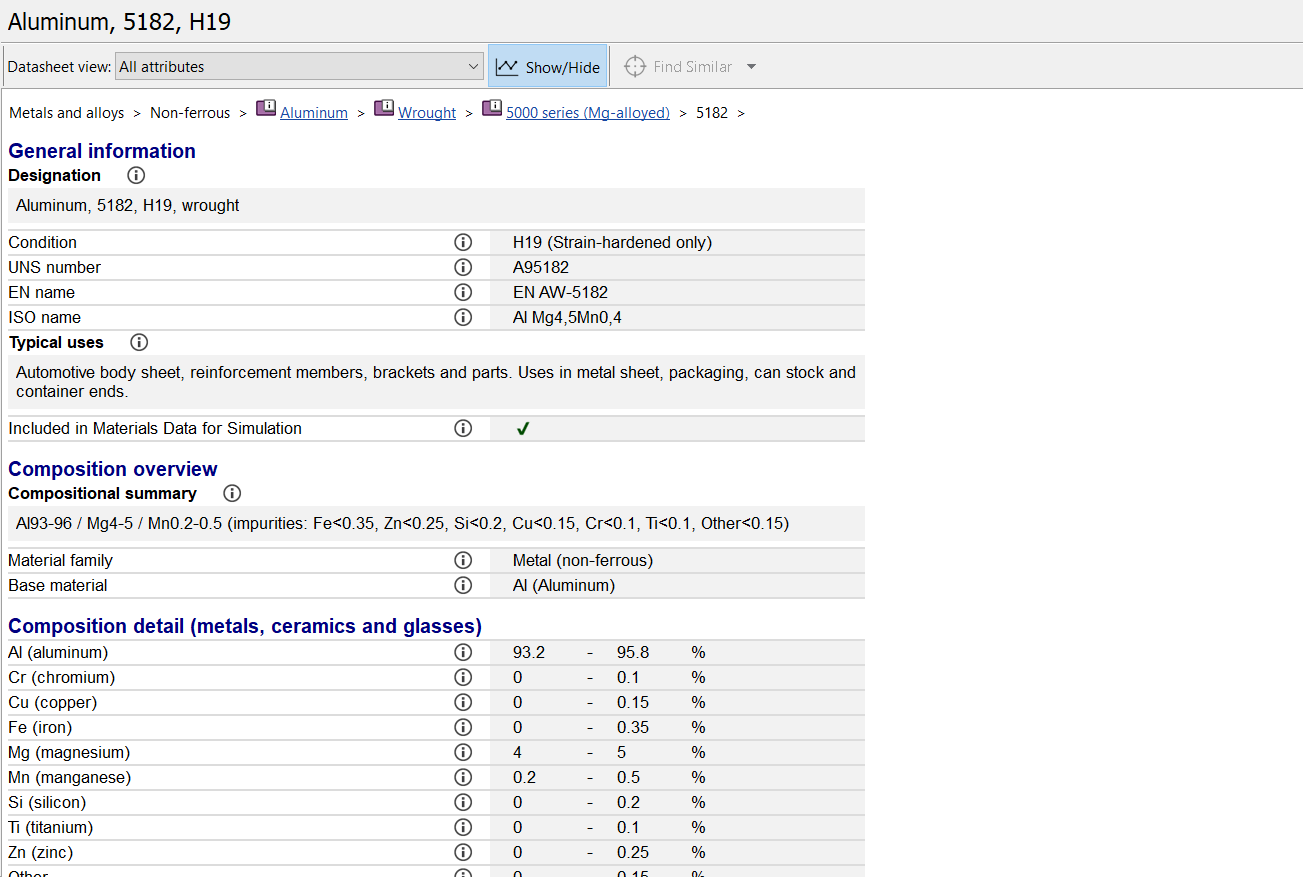
Looking at the price it appears that Aluminium 8091, T6 is about 12 times the price of Aluminium 5182, H19. So for that reason the choice landed on Aluminium 5182, H19.
After applying this material to the 3D model it was time to make a simulation. There’s been two different simulations that have been done. A simulation that simulates a heavy strong storm and a one that simulates someone throwing a beer bottle against the display.
Storm simulation For the storm simulation there had to be an approximation of how much force a heavy wind will apply to our screen. According to a research done by Kroftman (ref) at a wind speed of 115 km/h (classified as a heavy storm) there’s a pressure of 640 N/m2. So after applying this pressure to the 3D model, the results of the simulation can be seen in Figure 42, Figure 43 and Figure 44.
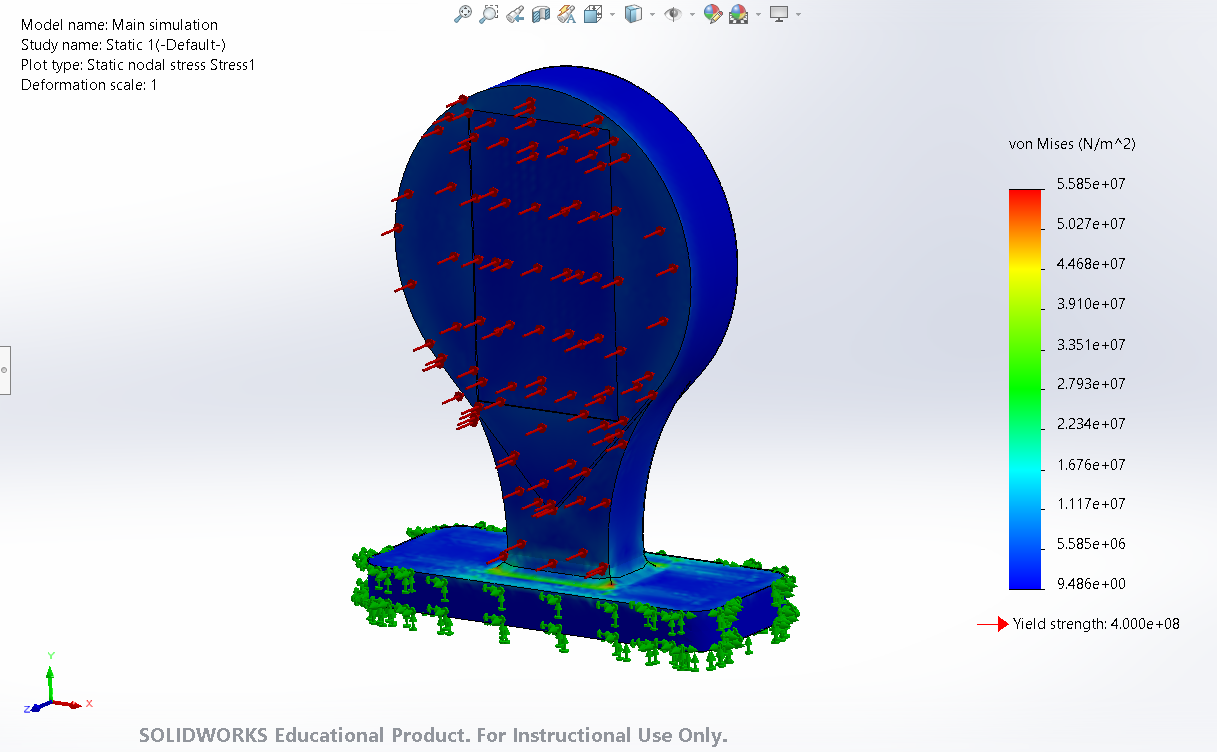
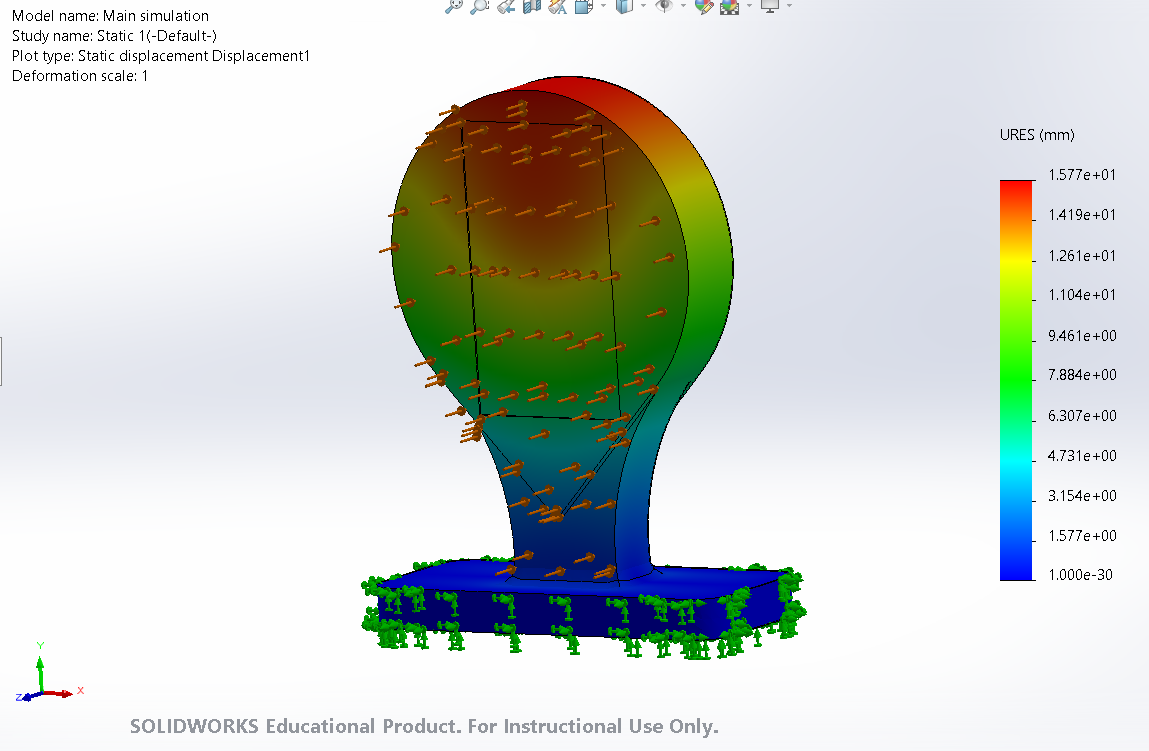
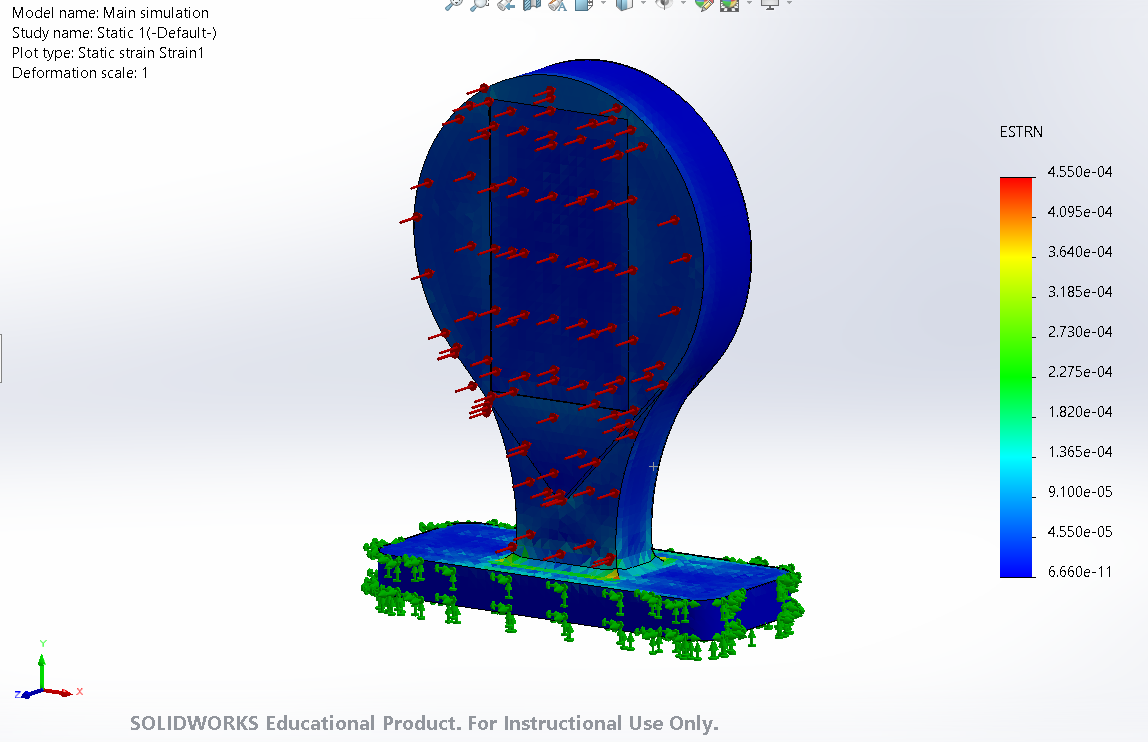
Looking at the results the display is able to resist a heavy storm. The maximum stress put on the casing is 5.585e+07 N/m^2 while the Yield strength of the aluminium is about 4e+08 N/m^2. Looking at the displacement simulation, there’s a displacement of about 16 mm maximum which is acceptable.
Second version
After critically looking at the simulations, there's been a conclusion that the simulation hasn't been fully accurate for the real life situation. In Figure 42 a simulation has been made where it's been assumed that the screen is made from aluminum and thus it's contributing to the overall strength of the structure. This is not accurate since the screen is made of a blend of materials, including plastics and ceramics. Furthermore, the screen is not part of the aluminum structure, it's only been joined using screws. For this reason a second simulation has been done which will more accurately represent real life. These simulations can be seen in Figure 45 (stress), Figure 46 (displacement) and Figure 47 (strain).
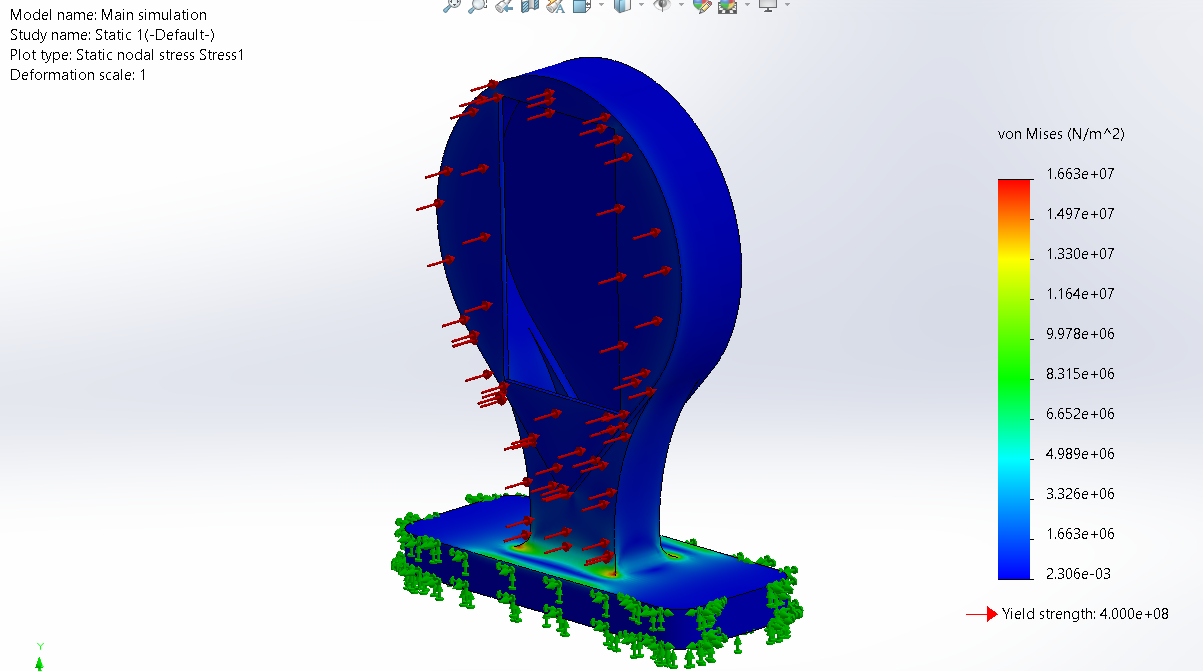
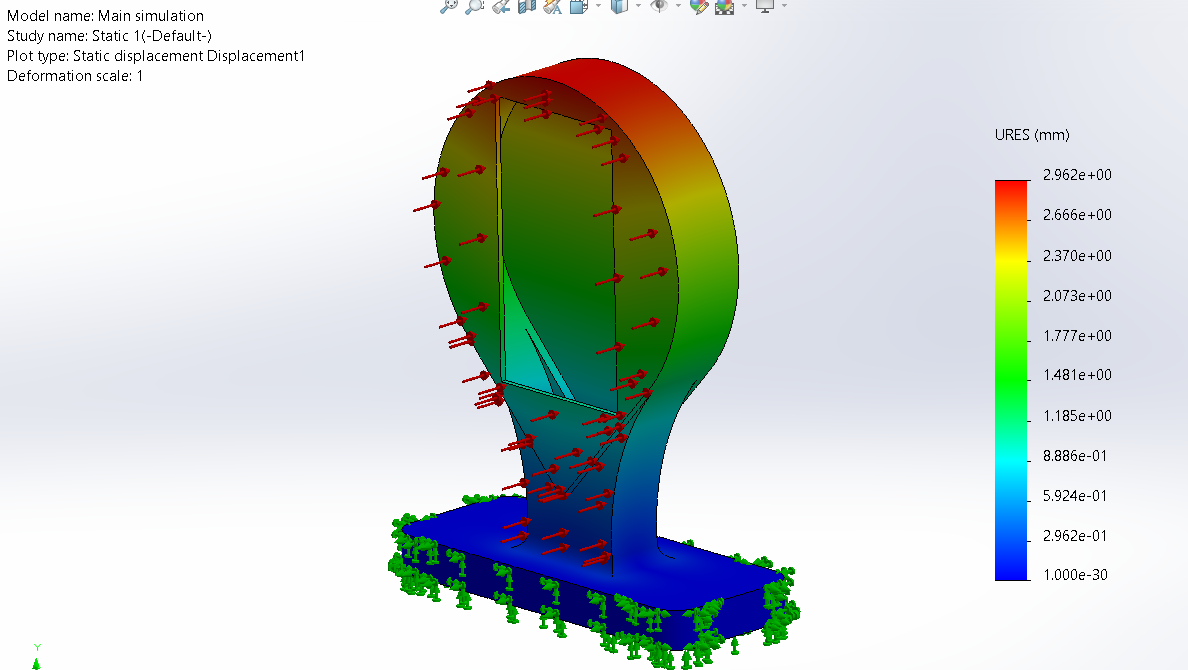
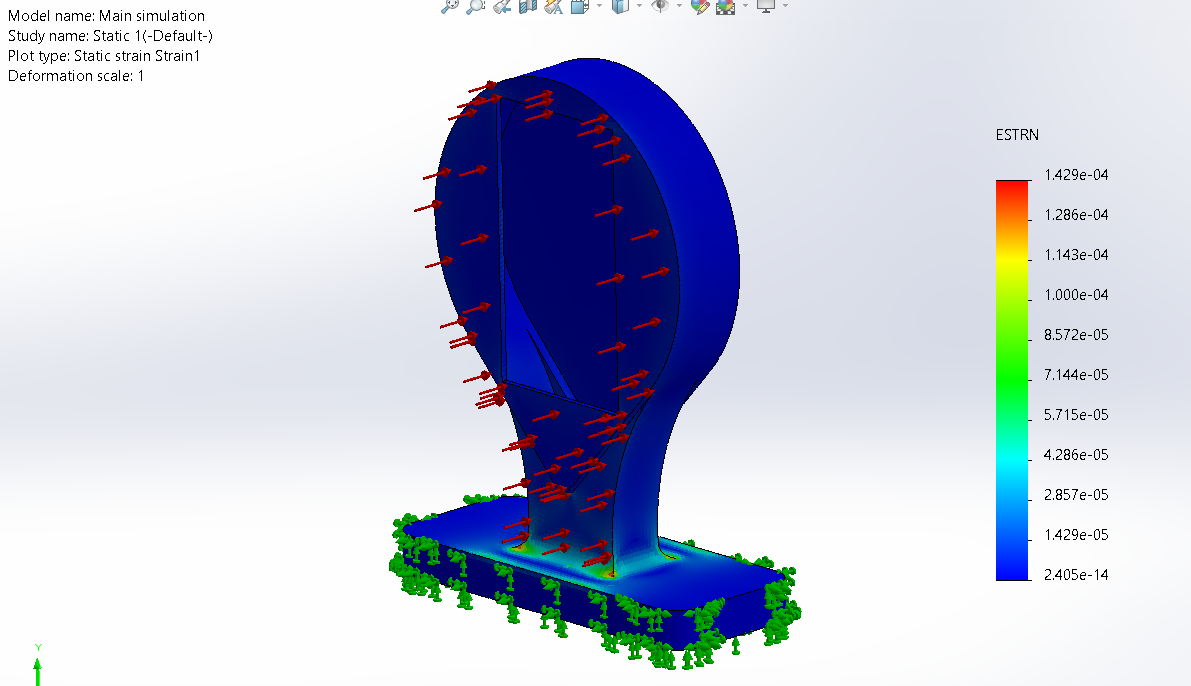
After these simulations the results of the stress, displacement and strain are still acceptable.
Beer bottle simulation To calculate the impact force of a beer bottle we assumed a beer bottle is 200 g, it has a velocity of 30 km/h (which is very fast) and a collision distance of 10 mm. This means there’ll be an impact force of 694.4 N. For the calculation, see Figure 48.
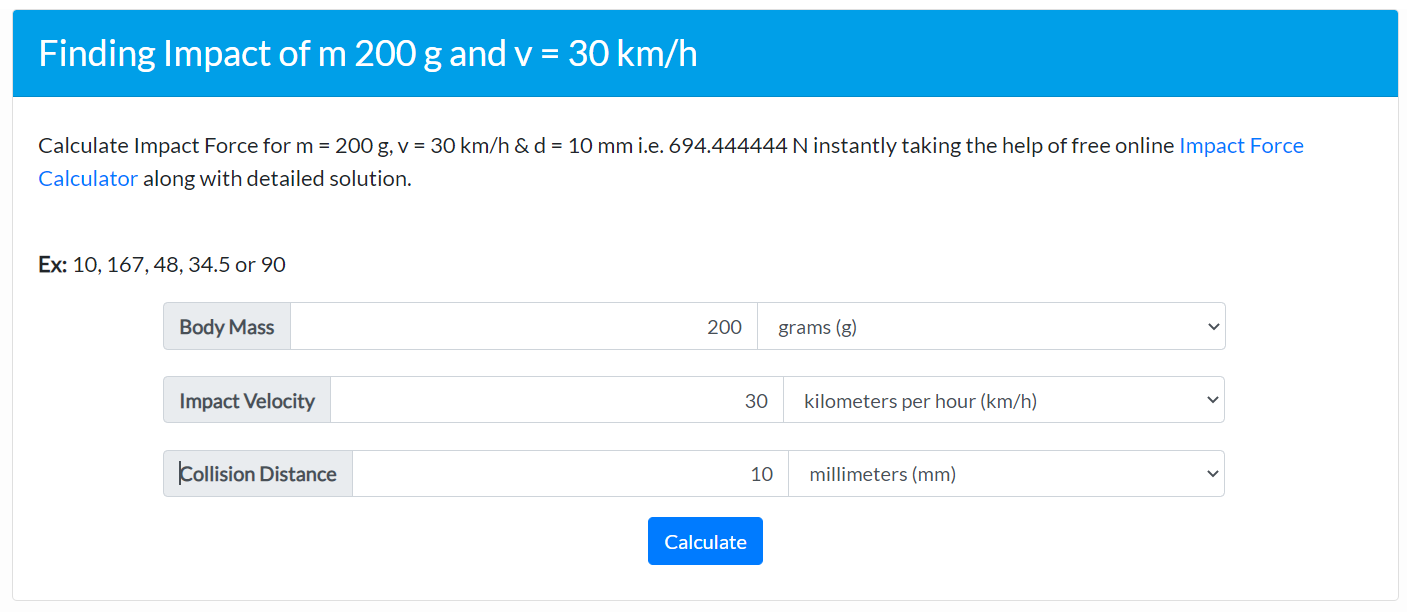
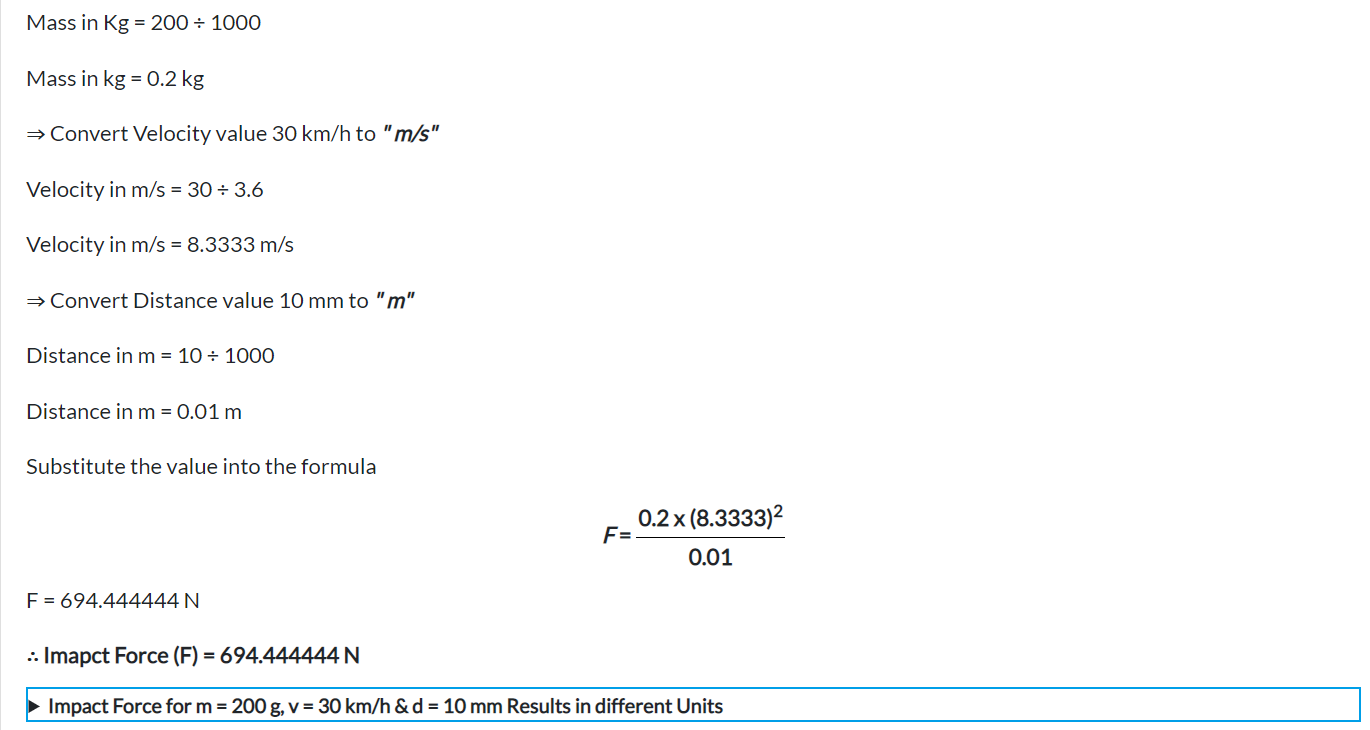
Using this impact force the results of the simulations can be seen in Figure 49, Figure 50 and Figure 51.
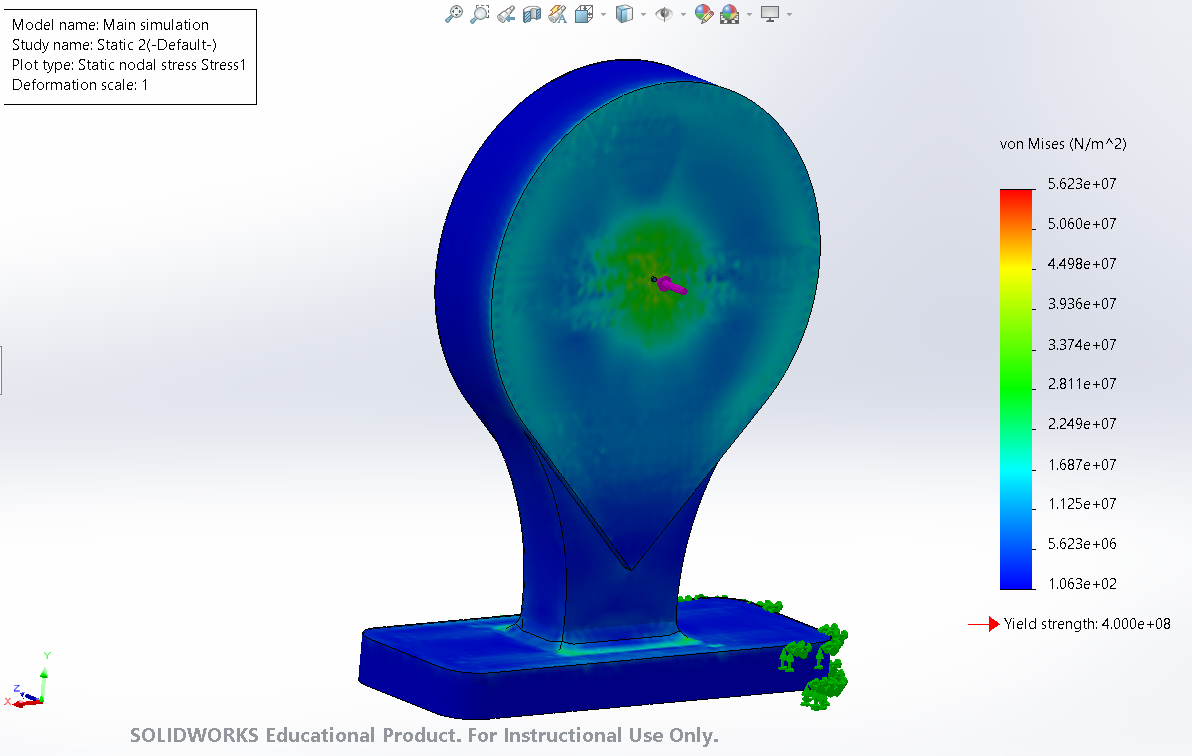
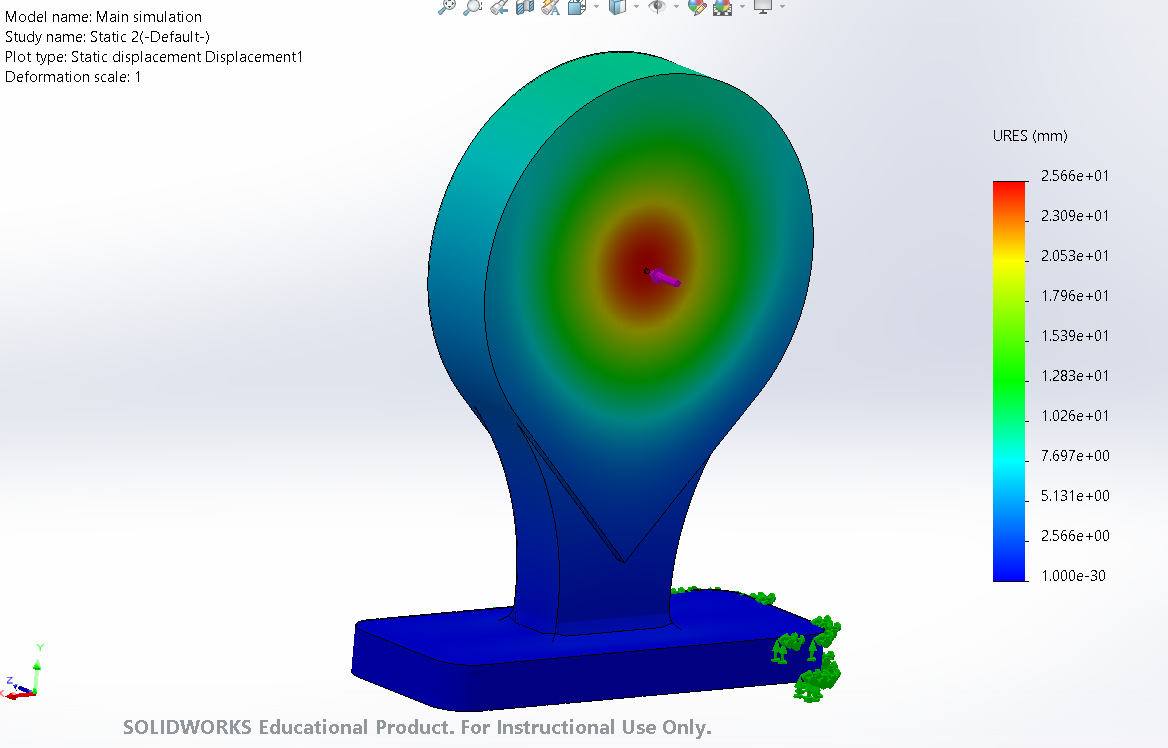
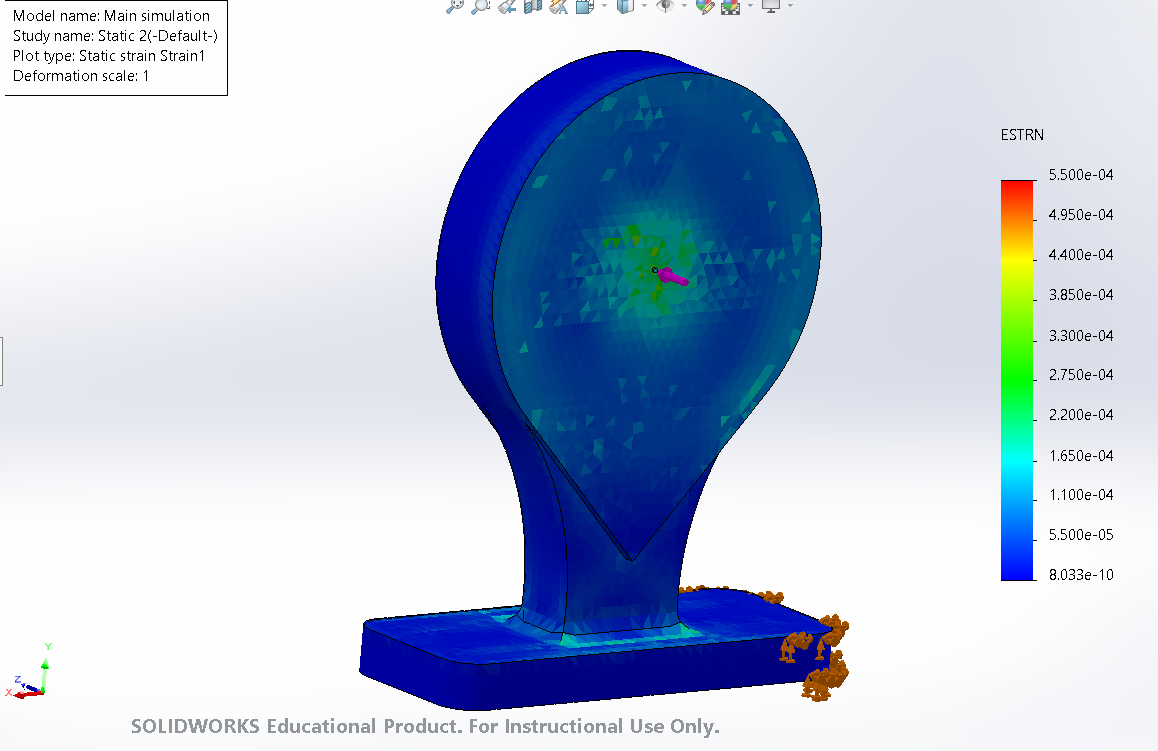
The maximum stress is 5.623e+07 N/m^2 while the yield strength is 4e+08 N/m^2. This means the product is able withstand a beer bottle thrown at it at extreme speeds.
7.5 Packaging Design
In Figure 52 the packaging solution is presented. The packaging is form fitted which means it's easy to apply and remove the packaging by hand. The screen will be transported in a truck and will be upright in the cargo. After placing the screen in the public space, the packaging will be removed by hand and be placed back in the truck. These packaging components will then be reused for new screens who are awaiting transport. After the packaging part is not fit for use anymore, it can be thrown away and it will be degraded by nature.
The packaging is made from mycelium, a material that is produced from agricultural waste and mushrooms/fungi. The agricultural waste will be mixed together with spores of a certain kind of mushroom (together with a few extra nutrients), this mixture will then be used to fill up a mold in the desired shape. Depending on the strain of mushroom and the size of the product, the hyphe (fungi roots) will take about 1-4 weeks to grow throughout the mold. After the mold is filled all the way the product will be taken out and the product will be dried at about 60-80 °C. This will dry out the moisture and kill the fungi, only leaving the root system and agricultural waste. This means the product is fully bio-producable and biodegradable since it only consists of natural components. [Elise VANDEN Elsacker, 2021] [Elise Elsacker, Simon Vandelook, Aurélie Van Wylick, Joske Ruytinx, Lars De Laet, Eveline Peeters, 2020] [Eben Bayer, 2012]
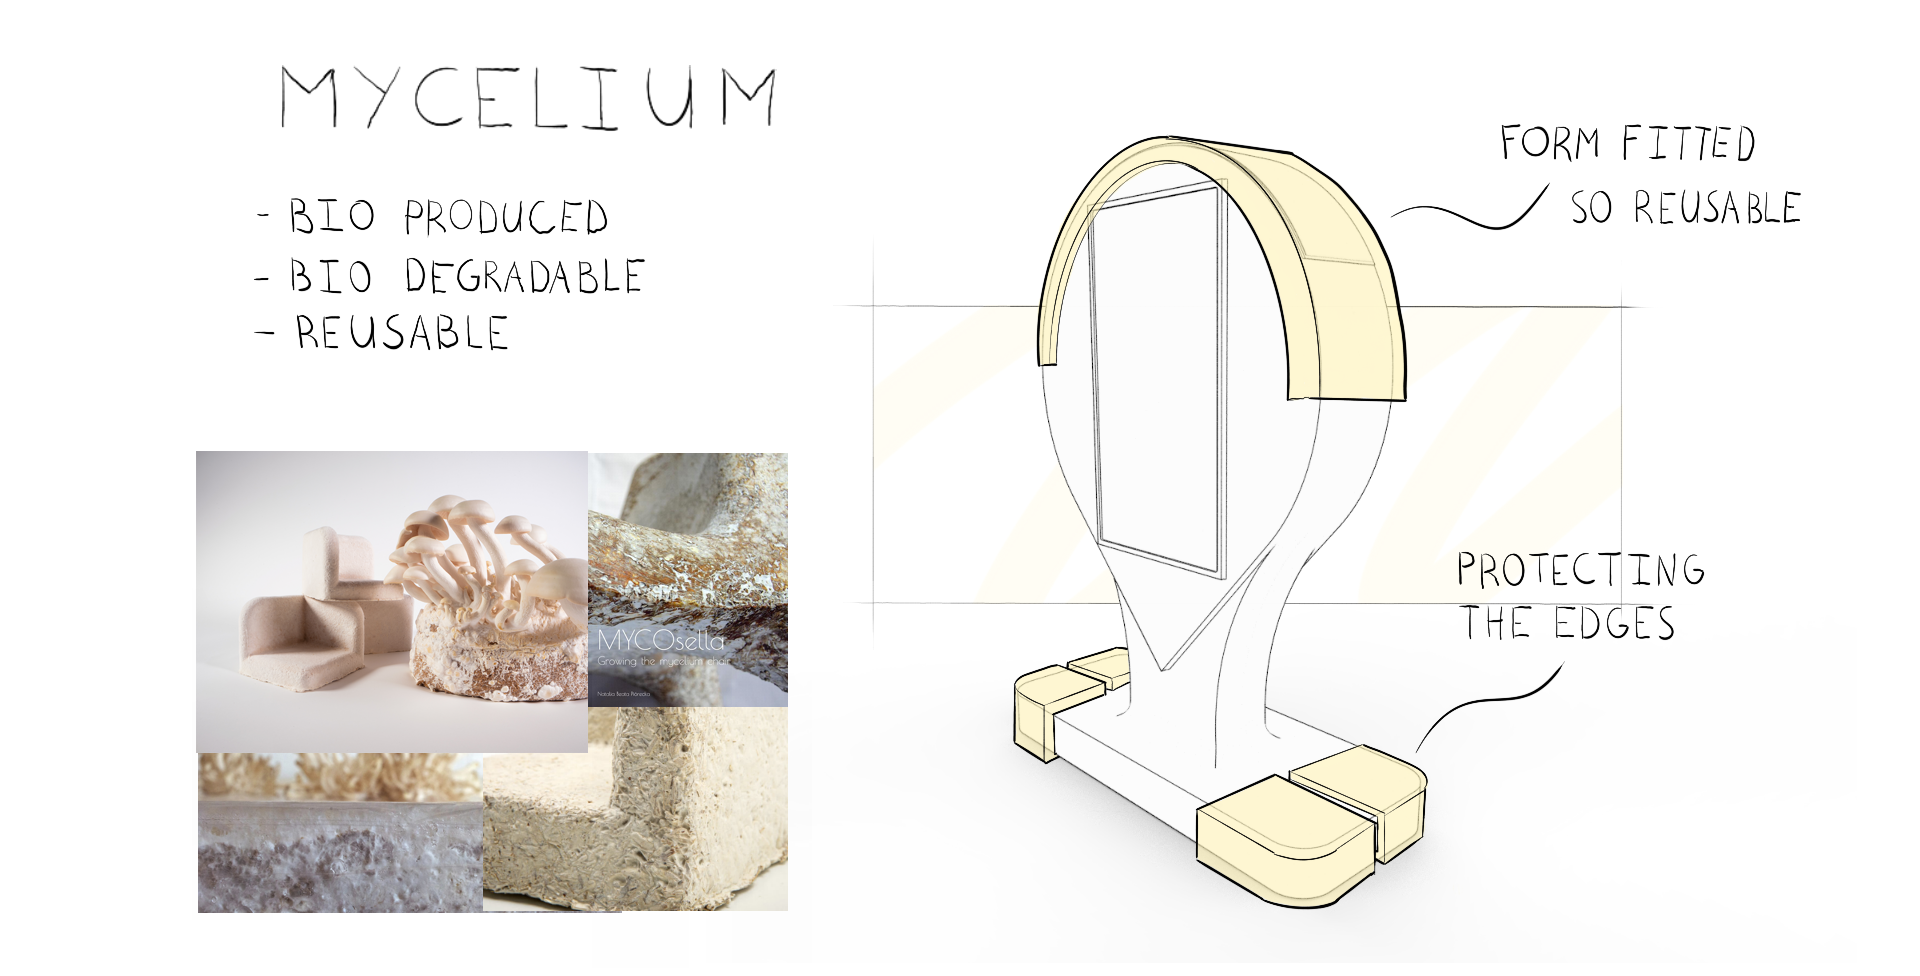
7.6 System Design
In this chapter, we will first study the electronic components needed for our product, then we will make the cardboard model of our product and finally the electrical diagram we need for our product.
7.6.1 Eletrical Components
For both the prototype and real project some electrical components are necessary. Seeing as the real production will be outsourced the focus lies on the prototype.
7.6.1.1 Proximty Sensor
The first component we need is a proximity sensor to check if potential users pass our display. Different options are compared in Table 25.


Through the comparison in Table 25 it is clear that the ultrasonic sensor HC-SR04 is the best option, in both price and range. Especially because this component is already available to the team.
7.6.1.2 Audio Components
To attract the attention of a bypasser the system should be able to play some sounds. Table 26 shows the two most popular audio shields for processing audio files. In Table 27 some speaker options are compared although for the prototype small 3 mm jack computer speakers will suffice.
| Component | Name | Price (€) | Specifics |
|---|---|---|---|
| A | Adafruit "Music Maker" | 55.04 | can support bigger stereo speakers; can decode MP3, AAC, Ogg Vorbis, WMA, MIDI, FLAC, WAV |
| B | SHIELD MP3 VS1053 | 11.60 | built for headphone use; can decode Ogg Vorbis, MP3, MP1 & MP2, MPEG4, WMA4.0, FLAC, WAV, General MIDI 1 and others; has pin extensions |
Even though the second shield is mainly built for earphones it will suffice for the prototype and is a lot cheaper, therefore this shield was chosen.
| Component | Name | Price (€) | Nominal Input Power |
|---|---|---|---|
| A | SP-2027NW | 3.50 | 1 W |
| B | FRS 5 X - 8 OHM | 12.69 | 5 W |
| C | SPEAKER 4 OHM | 4.50 | 3 W |
| D | Mini-Speaker | 8.00 | 3 W |
The chosen speaker is a stand-in as we will use what is currently available to us, but it is one of the same sort. A computer speaker with a 3 mm jack option.
7.6.1.3 Microcontroller
To be able to use our above chosen sensor and speaker our board does not have many requirements. It has to have a compatible audio shield and some extra pins and % Volt power option. Table 28 compares some popular options and some options for smaller boards.
| Component | Name | Digital I/O Pins | Power Supply | Connectivity | Dimensions | Price [€] | Photo |
|---|---|---|---|---|---|---|---|
| A | Arduino Uno R3 | 14 | 5 V | No built-in WI-FI or Bluetooth | 68.6 * 53.4 mm | 21.25 |  |
| B | ESP32-DEVKITC-32U | 22 | 3.3 V but 5 V possible | WI-FI and Bluetooth | 657 * 25.4 mm | 9.24 |  |
| C | Arduino Nano Every | 14 | 5 V | No built-in WI-FI or Bluetooth | 18 * 45 mm | 9.65 |  |
| D | Arduino Nano 33 IoT | 14 | 5 V | Wi-Fi and Bluetooth | 18 * 45 mm | 19.13 |  |
| E | Adafruit Trinket - 5V | 5 | 5 V | No built-in WI-FI or Bluetooth | 31 * 15.5 mm | 6.42 |  |
As we are using an audio shield to make playing audio files easier, the Arduino Uno R3 is the best choice because there are the most compatible shields for Arduino products. Our team is already in possession of an Elegoo Uno R3, a replica of the Arduino Uno R3, which is also cheaper than the original. Hence this board will be used, to save resources.
7.6.1.4 Conclusion
Table 29 shows our list of components with some components we already own and some we have to acquire.
| Component | Price [€] | Picture |
|---|---|---|
| Ultra Sonic Sensor HC-SR04 | (03.65) already available |  |
| (Elegoo) Uno R3 | (~38.00) already available |  |
| Laptop with touchscreen | (559.97) already available |  |
| Jumper Wires | (2.30) already available |  |
| Mini-Speaker | (8.00) already available |  |
| SHIELD MP3 VS1053 | 11.60 | |
| 16 GB Micro SD card | 8.72 |
7.6.2 Public Kiosk
For the real project an all in one solution would be the best option, seeing as it would be unnecessarily complicated to have every function handled by a different component when there are options that combine everything. The progammability is also simplified, because the software is already connected to the hardware. PARTTEAM & OEMKIOSKS offer a variety of ready set or custom solutions. For this project an proximity sensor and Wifi hotspot could be added to one of their digital interactive billboards to make an attractive starting point to our game. The PlasmV would be one of these options but we are currently in discourse with the company to find the best solution. One downside is that they already informed us that the kiosk is not able to be entirely powered by solar panels. We still compared possible solar panel options in the following chapter.
Overview of outdoor touch screens is presented in Table 30.
| Model | Size in inch | Brightness in cd/m2 | Resolution | IP-Rating | Power consumption in W |
|---|---|---|---|---|---|
| PLASMV | 55 | 4000 | 1920×1080 | IP40 | 275 |
| PLASMV | 65 | 4000 | 1920×1080 | IP40 | 510 |
| Exentia, EXK55SP.55S | 55 | 2500 | 1920×1080 | IP55 | 240 |
| Exentia, EXK55SP.70S | 70 | 2500 | 1920×1080 | IP55 | 290 |
| Exentia, EXK65S.P55XS | 55 | 2500 | 1920×1080 | IP65 | 1120 |
| Maxway, MW-551OE | 55 | 2000 | 1920×1080 | IP65 | 900 |
| Maxway, MW-651OE | 65 | 2000 | 3840×2160 | IP65 | 1300 |
7.6.3 Cardboard model
Figure 53 shows a cardboard model of the public kiosk. We did it to visualize our idea.

7.6.4 Solar panels
Table 31 shows the comparison between the different solar modules:
| Monocrystalline | Polycrystalline | Thin film/amorphous | Thin film/CIGS | |
|---|---|---|---|---|
| Efficiency | 18 - 25 % | 15 - 17% | 6-13 % | Ca. 17 % |
| Performance in bad condition (Shade, diffuse Light) | Declines | Declines | Only small declines | Only small declines |
| Performance in high temperature | Declines -3% | Declines -3% | Only small declines | Only small declines |
| Long-term testing | High performance, long lifetime | High performance, long lifetime | Less performance and lifetime | Less performance and lifetime |
| Weight | High | High | Very low | Very low |
| Flexibility | No | No | Yes | Yes |
| Costs | Most expensive | Cheaper than monocrystalline and CIGS | Cheaper than monocrystalline and CIGS | Cheaper than monocrystalline |
| Area needed for 1 kWp | 6-9 sqm | 7-10 sqm | - | - |
| Monocrystalline PV | Standard PV | PV with module optimization | PV with individual output optimization | |
|---|---|---|---|---|
| Additional inverter needed? | Yes | Yes | Yes | No |
| Performance in bad condition (Shade, diffuse Light) | Bad | Very good | Very good | Good |
| Effort to install | High | High | High | Low |
| Costs | + | ++ | ++ | ++/+++ |
| Costs with additional inverter | ++ | +++ | +++ | ++/+++ |
Summary of solar panel research:
- If there is a lot of free space for solar panels, a lot of diffuse light and not the perfect orientation possible, better choice is thin film solar panels.
- If there is limited space for solar panels, not a lot of diffuse light, Mono-/Polycrystalline solar panels are better choice.
Is parallel connection between solar modules needed? Parallel connection is in general more expensive in construction.
- Only necessary if some parts of the string (chain of solar modules) have different amount of light/shade, for us not really necessary because we can decide the shape of the roof on which the solar panels are placed.
Orientation and good light conditions can be chosen, and not a lot of solar panels will be used; it's not worth buying a PV inverter, cheaper in the end and also less effort to install.
7.6.5 Cuircuit Diagram
Figure 54 depicts the first simple hookup guide with a piezo instead of a speaker.

In Figure 55 the final components are connected. The audio shield is on top of the Arduino Uno board, connected to the speaker and the ultrasonic sensor.

7.7 Diagram of web app
In order to accurately list all the actions that can be performed in a web application, we created a diagram, which can be shown in Figure 56. During our work, we were inspired by the state diagram method, which shows transitions between various objects. The diagram may seem complicated at first, but it makes it easier for us to create specific pages in the web application. It starts with a black dot on the left and ends with a black dot at the bottom. As you can see in the diagram, we are starting already by making a decision. The user has two options:
- He/she is directly at the public display, selects a specific type of game on the screen (e.g. historical tour) and scans the QR code that is displayed. Once scanned, a web page opens, which is the start screen of our web application.
- If the user wants to start the game directly on his phone, he searches for the website.
In the first case (starting from display), the user sees 4 options on the start screen:
- “?” - Help on how to use the game
- “Create a room” - start a new game
- “Join a room” - join an already existing game
- “Change a tour” - change the selected tour
As in the first case, in the second version, the user also has the option to “Join a room”, get help “?”, and “Create a game”, which then redirects to the section with the selection of a tour.
As you can see, the difference between the two versions is that the user starting with the public display already has a tour selected and can change it, while the user starting with the phone selects a tour directly by phone.
Similarly, other actions are placed on the diagram.
Regardless of how the game starts, each user eventually ends up on a waiting page, where the game later begins and the user gets their first task.

7.8 Mockups of web app
We also prepared designs of what the web application would look like. Mockups are presented in Figures 57, 58 and 59 . The colors are chosen so that the contrast between them is suitable for mobile phones. We focused on making the application easy to use and intuitive. There are two different start screens depending on if the user scans the QR code from the public display, depicted in Figure 57 or if they get to the website from a search engine or otherwise. Then Figure 58 would be the start page.


7.9 Prototype
Seeing as the public display would be too big of an expense, a prototype or proof of concept was developed. The prototype consists of a laptop with touchscreen option and an Arduino Uno with an MP3 shield, to make playing audio possible, as well as a proximity (ultrasonic) sensor to detect when a person is walking by. On the laptop a website is presented, similar to what would be on the public display. It displays all the information about the app and leads the user to the game created to be played on the user's phone. Simultaneously or rather before a user approaches the laptop/public display the arduino setup detects objects passing by and plays sounds to attract attention and then waits a specific amount of time before scanning the area again to not play sounds too often. It is also programmed to not play sounds if an object is closer than 1 meter, hence at this distance the person probably already approached the device.
For the web application two use cases have to be distinguished: Main use case, when tourists access the web app via the public display. In this case, the tour is already selected and only a team name has to be entered before the game can be started. Use case two, when tourists reach the web app without having been to the kiosk before. In this case, the web app needs to give the user background information about the game and how to play it. There must also be the possibility to select a tour category. Accordingly, the processes and functions of the public kiosk must also be available in the web app. After the game has been started, the following functionalities and steps in the web app are the same for both usage scenarios. For the prototype, a tour consisting of 4 tasks was developed, which are always completed in the same order. In order to ensure a different first task for each team, this is selected at random. For each task, there is just enough information to make the task solvable, but not trivial. If the task is successfully solved, the team receives a certain amount of points. If the given information is not sufficient to solve the task, it is possible to acquire one or two hints. These must be “bought” with the points acquired. The tasks are also intended to ensure that the team can only solve them in the right place. This is either guaranteed by the fact that a QR code must be scanned at a certain location, or that the tasks can only be solved with specific knowledge on site. There is also the option of skipping each task. Of course, no points are awarded for this. In addition, the duration of the game is measured. For the final score, the duration of the game is weighted negatively (weakly weighted). After completing all tasks successfully, the final score is shown in comparison to the other teams. Depending on the score achieved, the team receives a voucher to a local restaurant or shop of varying value. In general, it is guaranteed that even if the browser is closed or the internet connection is lost, the score, the measured time, the name of the team, the currently opened page and all other game data is retained. This was all implemented in the web application build with AppGyver, which was also used to prototype the display application.
7.10 Functional Tests
For both components of our project, the public display prototype and the app, some functional tests were carried out. These are the results of said tests. Table 32 shows an overview of tests concluded, Table 33 shows the result for the web application and Table 34 for the public display.
| Number | Test | Results |
|---|---|---|
| T1 | Walking by the setup | Sounds were played |
| T2 | Letting different testers handle display application | Everything was clear and worked |
| T3 | Letting different testers try the web application | successful runthrough of application |
| T4 | Postman test: average request time | 168 ms - 182 ms |
| T5 | Postman test: average request size | 2.23 KB |
| UC | Number | Functionality | Working out of 10 ? |
|---|---|---|---|
| UC1 | 1 | Information about the game from web | 10/10 |
| UC1 & UC2 | 2 | Ability to start the game | 10/10 |
| UC1 & UC2 | 3 | Start tour at random task | 10/10 |
| UC1 & UC2 | 4 | Get to end page before doing same task again | 10/10 |
| UC1 & UC2 | 5 | Store points and team name on device storage | 10/10 |
| UC1 & UC2 | 6 | Get to same page again after closing browser | 10/10 |
| UC1 & UC2 | 7 | Scan CQ code / Check if people are at specific places | 10/10 |
| UC1 & UC2 | 8 | No ability to play the game without entering a team name | 10/10 |
| UC1 & UC2 | 9 | Show ranking and vouchers in the end | 0/10 |
| UC1 & UC2 | 10 | Giving information about tasks | 10/10 |
| UC1 & UC2 | 12 | Possibility to skip task | 10/10 |
| UC1 & UC2 | 13 | Measuring time | 10/10 |
| UC1 & UC2 | 12 | Game can be stopped at all times | 10/10 |
| Number | Functionality | Working? |
|---|---|---|
| F1 | Plays Sound when somebody walks by | yes |
| F2 | Rotates through different sounds | yes |
| F3 | Waits a specific time before scanning again | yes |
| F4 | Gives the user information about the game | yes |
| F5 | Let's the user choose a tour | yes |
| F6 | Presents the QR code to start the game on the phone | yes |
The application also fulfills all its use cases, for example giving information, letting the user choose the tour and presenting the first QR code leading to the web app. Team members not included in the programming, tested the application for usability and if every function was included. When testing F1, F2 and F3 everything worked as wanted. From ten tests by walking by the setup, ten succeeded and a random sound of five total sounds was played.
The different screens of the application of the display or a laptop/mobile phone are the solution of the functionalities four to six: Figure 60 shows an example of the implementation.

In case of the web application, tests concerning the functionalities and the performance were carried out. All the required functions were successfully implemented in the web app. You can find an example in Figure 61 including buttons to start the game, to exit the game, skip the task, get a hint or to open the camera to scan an QR code, furfilling some of the set functionalities. In addition, the tests on the functioning of the web app logic were also passed. For example, it can be ensured that the game can only be started after a team name has been entered. For the performance test, each page of the web app was sent ten requests and both the time of the requests and their size were evaluated. This resulted in a range of an average request time of 168 ms - 182 ms and an average request size of 2.23 KB.

Overall testing and development was very sucessfull. Nearly all the functionalities have been implemented and performance was also satisfactory. Further testing could be done with a few potential users from the target group.
7.11 Conclusion
Throughout this chapter we have presented the development of our project in chronological order. We have presented the idea of the project and this idea has gradually become reality. The functionalities that we wanted to implement during the ideation are now realized. In the end a complete prototype of our project was sucessfully created and tested. The proof of concept showed that the development of the real product could be beneficial.
In the next chapter we will conclude this report.
8. Conclusions
8.1 Discussion
The purpose of this project was to design and develop a new environmentally friendly product that could sustain itself in the market and not conflict with ethical, deontological, and sustainable principles. Our goal was to find a solution for young tourists who are looking for innovative ways to explore the city, in an interesting and engaging way that would keep them entertained, and also to provide for the needs of city authorities who are looking for innovative ways to attract tourists. After extensive research and many discussions, we decided on a solution that would meet all the needs of our target groups.
Our solution was to combine a game in a web application and a public display that would attract attention and encourage interaction. Users can take on the challenge of exploring the city alone, but also with a group of friends, competing with each other and seeing who is better and who can solve the puzzle faster. Thanks to cooperation with local businesses, we can offer all players vouchers to local restaurants, stores, etc. Our solution benefits not only the company itself, but the entire community - users who can explore the city for free and receive vouchers, local businesses who gain new customers, and city authorities who become recognized as innovative.
During our work, we also explored the sustainability of the product, understanding what sustainability means, looking for eco-efficient solutions, and looking at life cycle assessment. We also focused on various ethical and deontological issues. In addition, the project grew more and more over the course of this semester. It started with defining the project and researching existing similar products and ideas. After defining our solution, we got down to detailing it and specifying its functionalities. To better visualize our idea, we built a model out of cardboard. We created technical drawings of the project, as well as a 3D model and electrical schematic. We then continued to research and select materials to be used for the product. We created a prototype of a public display and web app, defined functional tests, and tested our solution.
The overall goal of the European Project Semester was to offer project-based learning experiences and to challenge team members from different educational backgrounds and nationalities to combine their competencies to solve a real-world problem. As a team, we can say that we were successful in meeting this challenge. During this semester, we developed our skills, both soft and hard.
While analyzing our solution, we noticed that there are some elements that we could be improved and that we should focus on if we continue our work on the project. We will talk about them in the future development section below.
8.2 Future Development
After implementing the service in the city of Porto, it's time to expand to other cities. The success in Porto can be used as a way of marketing it to other cities, while at the same time building a community on social media. During the growth it's important to keep servicing all the existing screens, so if the expansion will grow too big, it's an option to look into splitting the company. One part focuses on servicing the existing screens/cities and optimizing their experience. The other part will focus on expanding to different cities and building a community.
Regarding the design, the material choice can be optimized. The coating of epoxy makes it difficult to recycle the aluminium, so it's recommended to find a solution to this. This can be done by choosing a different type of coating, material or way of protecting the casing.